地学前缘 ›› 2026, Vol. 33 ›› Issue (1): 511-522.DOI: 10.13745/j.esf.sf.2025.10.6
周斐然1( ), 尹子悦1, 孙晓敏2, 宋健3, 杨蕴3, 吴剑锋1,*()
收稿日期:2025-06-20
修回日期:2025-10-20
出版日期:2026-01-25
发布日期:2025-11-10
通信作者:
*吴剑锋(1971—),男,博士,教授,博士生导师,主要从事地下水数值模拟与优化研究。E-mail:jfwu@nju.edu.cn
作者简介:周斐然(2001—),女,硕士研究生,主要从事地下水数值模拟研究。E-mail:feiranzhou@smail.nju.edu.cn
基金资助:
ZHOU Feiran1(), YIN Ziyue1, SUN Xiaomin2, SONG Jian3, YANG Yun3, WU Jianfeng1,*()
Received:2025-06-20
Revised:2025-10-20
Online:2026-01-25
Published:2025-11-10
摘要:
绿洲作为干旱区生态安全的核心载体,其稳定性高度依赖地下水资源的可持续性,地下水潜力区的精准识别能为干旱区水资源优化配置提供决策支撑。本研究将民勤盆地作为西北干旱区内陆河流域的典型绿洲系统,提出了一种融合数值模拟和机器学习的干旱区地下水潜力综合评价方法。通过地下水数值模拟获取高精度的地下水埋深空间分布以及渗透系数、给水度两个关键参数,综合考虑气象、水文、土地利用、地形和地质5大类共18个影响因素,分别采用6种机器学习模型,系统评估了地下水潜力空间分布特征。研究结果表明:绿洲区地下水潜力呈现南高北低的空间格局,LightGBM模型(准确率为87.87%,F1分数为0.716,AUC为0.943)预测地下水潜力表现最优,XGBoost和随机森林次之,支持向量机、K近邻和BP神经网络的预测性能则相对较弱。在此基础上,通过随机森林、XGBoost和LightGBM 3个树模型计算特征重要性,结果显示地下水埋深(权重17.1%~18.5%)是影响民勤绿洲地下水潜力的关键主控因素,其次是潜在蒸散发(12.5%~14.2%)、大气降水(8.6%~12.5%)、NDVI(6.2%~12.8%)及地表高程(6.7%~11.4%)。本文提出的研究方法适用于干旱区的地下水潜力多参数评估体系,为干旱区绿洲地下水资源评价提供了科学依据。
中图分类号:
周斐然, 尹子悦, 孙晓敏, 宋健, 杨蕴, 吴剑锋. 融合数值模拟和机器学习的民勤盆地地下水潜力评价与主控因素识别[J]. 地学前缘, 2026, 33(1): 511-522.
ZHOU Feiran, YIN Ziyue, SUN Xiaomin, SONG Jian, YANG Yun, WU Jianfeng. Integrating numerical simulation and machine learning for identification of groundwater potential zone and its governing factors in the Minqin Basin, Northwest China[J]. Earth Science Frontiers, 2026, 33(1): 511-522.

图1 (a)研究区地理位置;(b)乡镇及监测井分布;(c)地下水开采井分布及地下水数值模型基本信息
Fig.1 (a) The geographical location of the study area, (b) distribution of townships and monitoring wells and (c) the groundwater abstraction wells in the model domain and the basic conditions for the numerical simulation model.
| 影响因素 | 评价指标 | 指标缩写 | 原始空间分辨率 | 数据来源 |
|---|---|---|---|---|
| 气象因素 | 降水 | PRE | 1 km×1 km | 国家地球系统科学数据中心 |
| 实际蒸散发 | ET | 0.05°×0.05° | Niu等[ | |
| 潜在蒸散发 | PET | 1 km×1 km | 彭守璋等[ | |
| 水文因素 | 地下水埋深 | GWD | 800 m×800 m | 数值模型 |
| 地形湿度指数 | TWI | 12.5 m×12.5 m | 数字高程模型空间分析 | |
| 河流强度指数 | SPI | 12.5 m×12.5 m | 数字高程模型空间分析 | |
| 河网密度 | DD | 1 km×1 km | 数字高程模型空间分析 | |
| 土地利用因素 | 归一化植被指数 | NDVI | 30 m×30 m | Parizi等[ |
| 土地利用类型 | LUCC | 30 m×30 m | Yang等[ | |
| 地形因素 | 地表高程 | DEM | 12.5 m×12.5 m | ALOS PALSAR数据 |
| 坡度 | Slope | 12.5 m×12.5 m | 数字高程模型空间分析 | |
| 坡向 | Asp | 12.5 m×12.5 m | 数字高程模型空间分析 | |
| 泥沙输送指数 | STI | 12.5 m×12.5 m | 数字高程模型空间分析 | |
| 地形位置指数 | TPI | 12.5 m×12.5 m | 数字高程模型空间分析 | |
| 地质因素 | 土壤水分 | SM | 0.05°×0.05° | 宋沛林等[ |
| 土壤类型 | SC | 0.5'×0.5' | 世界土壤数据库 | |
| 渗透系数 | K | — | 数值模型 | |
| 给水度 | SY | — | 数值模型 |
表1 地下水潜力评价指标体系
Table 1 The key indicators for the groundwater potential assessment
| 影响因素 | 评价指标 | 指标缩写 | 原始空间分辨率 | 数据来源 |
|---|---|---|---|---|
| 气象因素 | 降水 | PRE | 1 km×1 km | 国家地球系统科学数据中心 |
| 实际蒸散发 | ET | 0.05°×0.05° | Niu等[ | |
| 潜在蒸散发 | PET | 1 km×1 km | 彭守璋等[ | |
| 水文因素 | 地下水埋深 | GWD | 800 m×800 m | 数值模型 |
| 地形湿度指数 | TWI | 12.5 m×12.5 m | 数字高程模型空间分析 | |
| 河流强度指数 | SPI | 12.5 m×12.5 m | 数字高程模型空间分析 | |
| 河网密度 | DD | 1 km×1 km | 数字高程模型空间分析 | |
| 土地利用因素 | 归一化植被指数 | NDVI | 30 m×30 m | Parizi等[ |
| 土地利用类型 | LUCC | 30 m×30 m | Yang等[ | |
| 地形因素 | 地表高程 | DEM | 12.5 m×12.5 m | ALOS PALSAR数据 |
| 坡度 | Slope | 12.5 m×12.5 m | 数字高程模型空间分析 | |
| 坡向 | Asp | 12.5 m×12.5 m | 数字高程模型空间分析 | |
| 泥沙输送指数 | STI | 12.5 m×12.5 m | 数字高程模型空间分析 | |
| 地形位置指数 | TPI | 12.5 m×12.5 m | 数字高程模型空间分析 | |
| 地质因素 | 土壤水分 | SM | 0.05°×0.05° | 宋沛林等[ |
| 土壤类型 | SC | 0.5'×0.5' | 世界土壤数据库 | |
| 渗透系数 | K | — | 数值模型 | |
| 给水度 | SY | — | 数值模型 |

图2 民勤盆地地下水潜力影响因素空间分布图
Fig.2 The spatial distributions of driving factors affecting the groundwater potential in the study area

图3 (a)监测井地下水位非稳定流拟合结果;(b)地下水埋深分布;(c)渗透系数;(d)给水度空间分布
Fig.3 (a) The correlation relationship between observed and calculated groundwater levels, the distribution of (b) groundwater depth, (c) hydraulic conductivity and (d) specific yield in the study area
| 模型 | 超参数 | 搜索空间 | 最优配置 |
|---|---|---|---|
| SVC | kernel | [‘rbf’, ‘linear’, ‘poly’] | ‘rbf’ |
| C | loguniform(1e-2, 1e3) | 3 | |
| gamma | loguniform(1e-4, 1e1) | 0.1 | |
| KNN | n_neighbors | [3, 5, 7, 9, 11, 13, 15] | 7 |
| metric | [‘euclidean’, ‘minkowski’, ‘manhattan’] | ‘minkowski’ | |
| p | [1, 2, 3] | 1 | |
| BP | hidden_layer_sizes | [(100,), (50, 50, 50), (200,), (100, 50, 50)] | (100, 50, 50) |
| activation | [‘relu’, ‘tanh’, ‘logistic’] | ‘relu’ | |
| solver | [‘adam’, ‘sgd’, ‘lbfgs’] | ‘adam’ | |
| learning_rate_init | loguniform(1e-4, 1e-1) | 0.003 | |
| alpha | loguniform(1e-5, 1e-1) | 0.02 | |
| RF | n_estimators | randint(100, 1000) | 306 |
| max_depth | range(10, 50) | 29 | |
| min_samples_split | randint(2, 10) | 4 | |
| min_samples_leaf | randint(1, 10) | 2 | |
| min_impurity_decrease | uniform(0, 0.1) | 0.0001 | |
| XGBoost | n_estimators | randint(100, 1000) | 515 |
| learning_rate | uniform(0.01, 0.3) | 0.06 | |
| max_depth | randint(3, 30) | 20 | |
| colsample_bytree | uniform(0.5, 1) | 0.9 | |
| subsample | uniform(0.6, 1.0) | 0.765 | |
| reg_alpha | uniform(0, 1) | 0.6 | |
| reg_lambda | uniform(0, 1) | 0.5 | |
| early_stopping_rounds | [10] | 10 | |
| LightGBM | n_estimators | randint(100, 1000) | 301 |
| learning_rate | uniform(0.01, 0.3) | 0.204 | |
| max_depth | randint(3, 20) | 14 | |
| num_leaves | randint(10, 50) | 45 | |
| subsample | uniform(0.7, 1.0) | 0.788 | |
| reg_alpha | uniform(0, 1.0) | 0.598 | |
| reg_lambda | uniform(0, 1.0) | 0.922 | |
| early_stopping_rounds | [10] | 10 |
表2 模型超参数空间及最优配置
Table 2 Hyperparameter space and optimal configurations for models
| 模型 | 超参数 | 搜索空间 | 最优配置 |
|---|---|---|---|
| SVC | kernel | [‘rbf’, ‘linear’, ‘poly’] | ‘rbf’ |
| C | loguniform(1e-2, 1e3) | 3 | |
| gamma | loguniform(1e-4, 1e1) | 0.1 | |
| KNN | n_neighbors | [3, 5, 7, 9, 11, 13, 15] | 7 |
| metric | [‘euclidean’, ‘minkowski’, ‘manhattan’] | ‘minkowski’ | |
| p | [1, 2, 3] | 1 | |
| BP | hidden_layer_sizes | [(100,), (50, 50, 50), (200,), (100, 50, 50)] | (100, 50, 50) |
| activation | [‘relu’, ‘tanh’, ‘logistic’] | ‘relu’ | |
| solver | [‘adam’, ‘sgd’, ‘lbfgs’] | ‘adam’ | |
| learning_rate_init | loguniform(1e-4, 1e-1) | 0.003 | |
| alpha | loguniform(1e-5, 1e-1) | 0.02 | |
| RF | n_estimators | randint(100, 1000) | 306 |
| max_depth | range(10, 50) | 29 | |
| min_samples_split | randint(2, 10) | 4 | |
| min_samples_leaf | randint(1, 10) | 2 | |
| min_impurity_decrease | uniform(0, 0.1) | 0.0001 | |
| XGBoost | n_estimators | randint(100, 1000) | 515 |
| learning_rate | uniform(0.01, 0.3) | 0.06 | |
| max_depth | randint(3, 30) | 20 | |
| colsample_bytree | uniform(0.5, 1) | 0.9 | |
| subsample | uniform(0.6, 1.0) | 0.765 | |
| reg_alpha | uniform(0, 1) | 0.6 | |
| reg_lambda | uniform(0, 1) | 0.5 | |
| early_stopping_rounds | [10] | 10 | |
| LightGBM | n_estimators | randint(100, 1000) | 301 |
| learning_rate | uniform(0.01, 0.3) | 0.204 | |
| max_depth | randint(3, 20) | 14 | |
| num_leaves | randint(10, 50) | 45 | |
| subsample | uniform(0.7, 1.0) | 0.788 | |
| reg_alpha | uniform(0, 1.0) | 0.598 | |
| reg_lambda | uniform(0, 1.0) | 0.922 | |
| early_stopping_rounds | [10] | 10 |
| 模型方案 | 评价指标 | 传统机器学习模型 | 集成学习模型 | |||||
|---|---|---|---|---|---|---|---|---|
| SVC | KNN | BP | RF | XGBoost | LightGBM | |||
| 方案A | OA/% | 78.55 | 80.19 | 80.08 | 85.66 | 86.88 | 87.87 | |
| F1 | 0.481 | 0.588 | 0.582 | 0.692 | 0.725 | 0.716 | ||
| AUC | 0.772 | 0.816 | 0.832 | 0.914 | 0.951 | 0.943 | ||
| 方案B | OA/% | 73.40 | 79.89 | 78.45 | 82.30 | 85.23 | 85.57 | |
| F1 | 0.131 | 0.558 | 0.533 | 0.595 | 0.686 | 0.705 | ||
| AUC | 0.626 | 0.807 | 0.800 | 0.875 | 0.920 | 0.917 | ||
| 方案C | OA/% | 74.12 | 77.07 | 75.18 | 83.46 | 77.85 | 79.56 | |
| F1 | 0.008 | 0.509 | 0.326 | 0.632 | 0.448 | 0.523 | ||
| AUC | 0.686 | 0.722 | 0.732 | 0.874 | 0.811 | 0.820 | ||
表3 不同机器学习模型分类性能比较
Table 3 Comparison of classification performance among six machine learning models
| 模型方案 | 评价指标 | 传统机器学习模型 | 集成学习模型 | |||||
|---|---|---|---|---|---|---|---|---|
| SVC | KNN | BP | RF | XGBoost | LightGBM | |||
| 方案A | OA/% | 78.55 | 80.19 | 80.08 | 85.66 | 86.88 | 87.87 | |
| F1 | 0.481 | 0.588 | 0.582 | 0.692 | 0.725 | 0.716 | ||
| AUC | 0.772 | 0.816 | 0.832 | 0.914 | 0.951 | 0.943 | ||
| 方案B | OA/% | 73.40 | 79.89 | 78.45 | 82.30 | 85.23 | 85.57 | |
| F1 | 0.131 | 0.558 | 0.533 | 0.595 | 0.686 | 0.705 | ||
| AUC | 0.626 | 0.807 | 0.800 | 0.875 | 0.920 | 0.917 | ||
| 方案C | OA/% | 74.12 | 77.07 | 75.18 | 83.46 | 77.85 | 79.56 | |
| F1 | 0.008 | 0.509 | 0.326 | 0.632 | 0.448 | 0.523 | ||
| AUC | 0.686 | 0.722 | 0.732 | 0.874 | 0.811 | 0.820 | ||
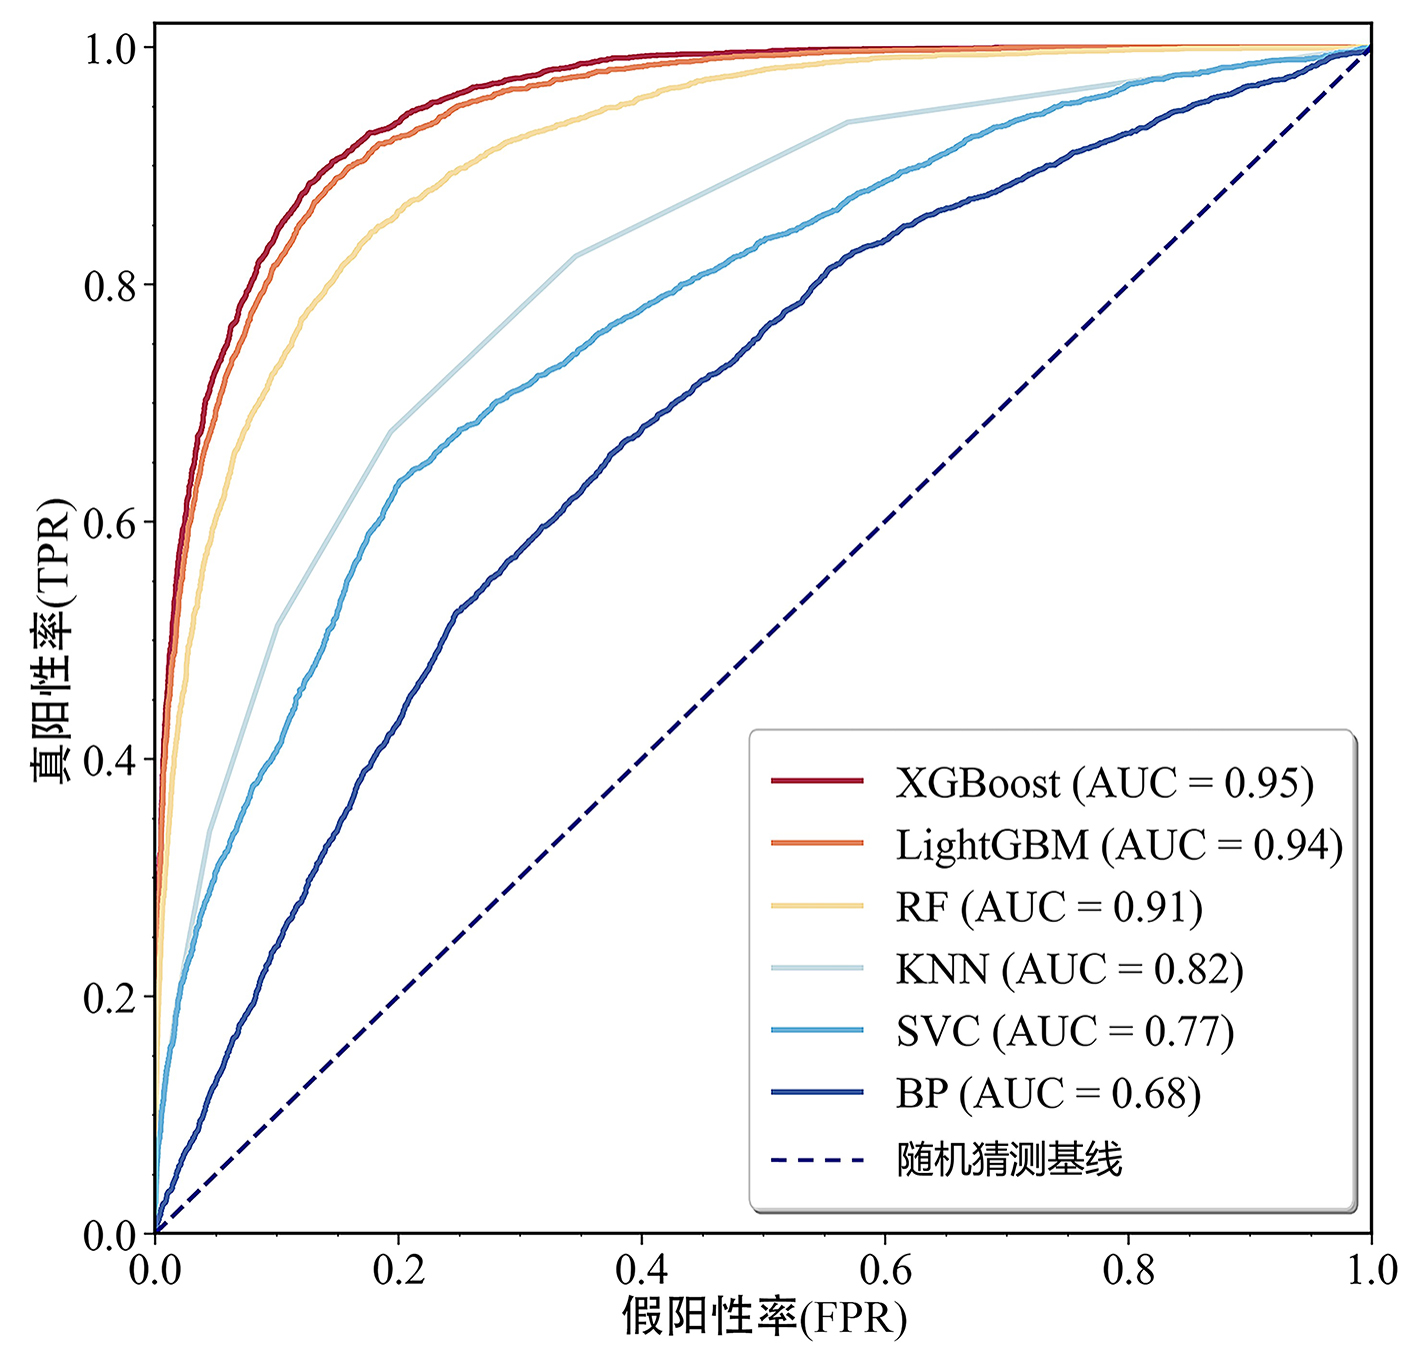
图4 不同机器学习模型的ROC曲线性能
Fig.4 The ROC curves of different machine learning models

图5 不同机器学习模型识别的地下水潜力等级分区结果
Fig.5 The identified groundwater potential zones based on different machine learning models
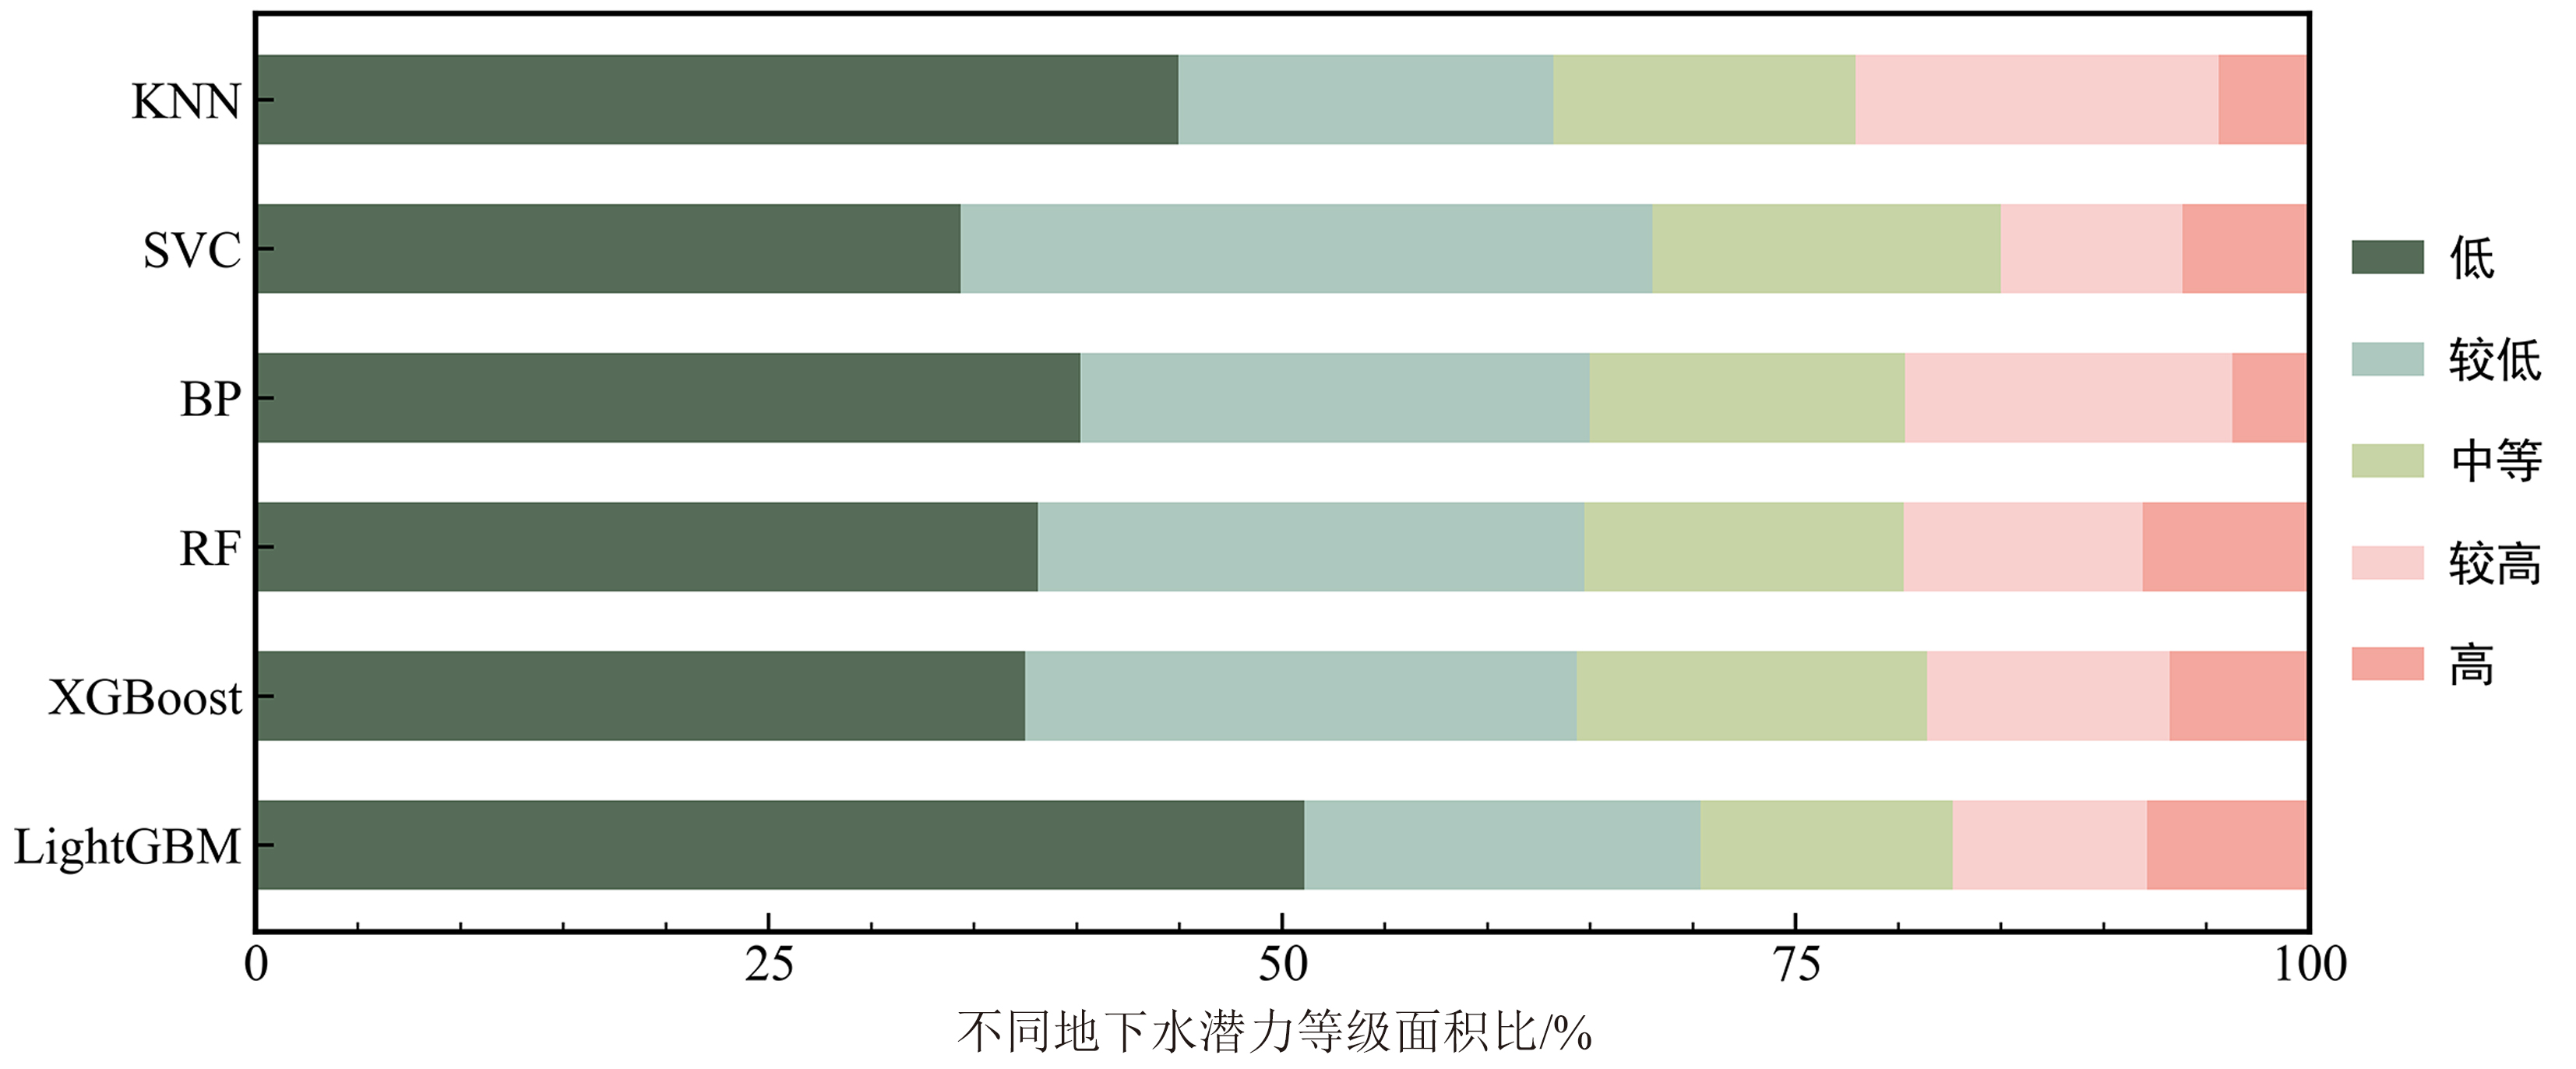
图6 不同机器学习模型识别的地下水潜力等级面积占比
Fig.6 The area proportion of groundwater potential classification based on different machine learning models
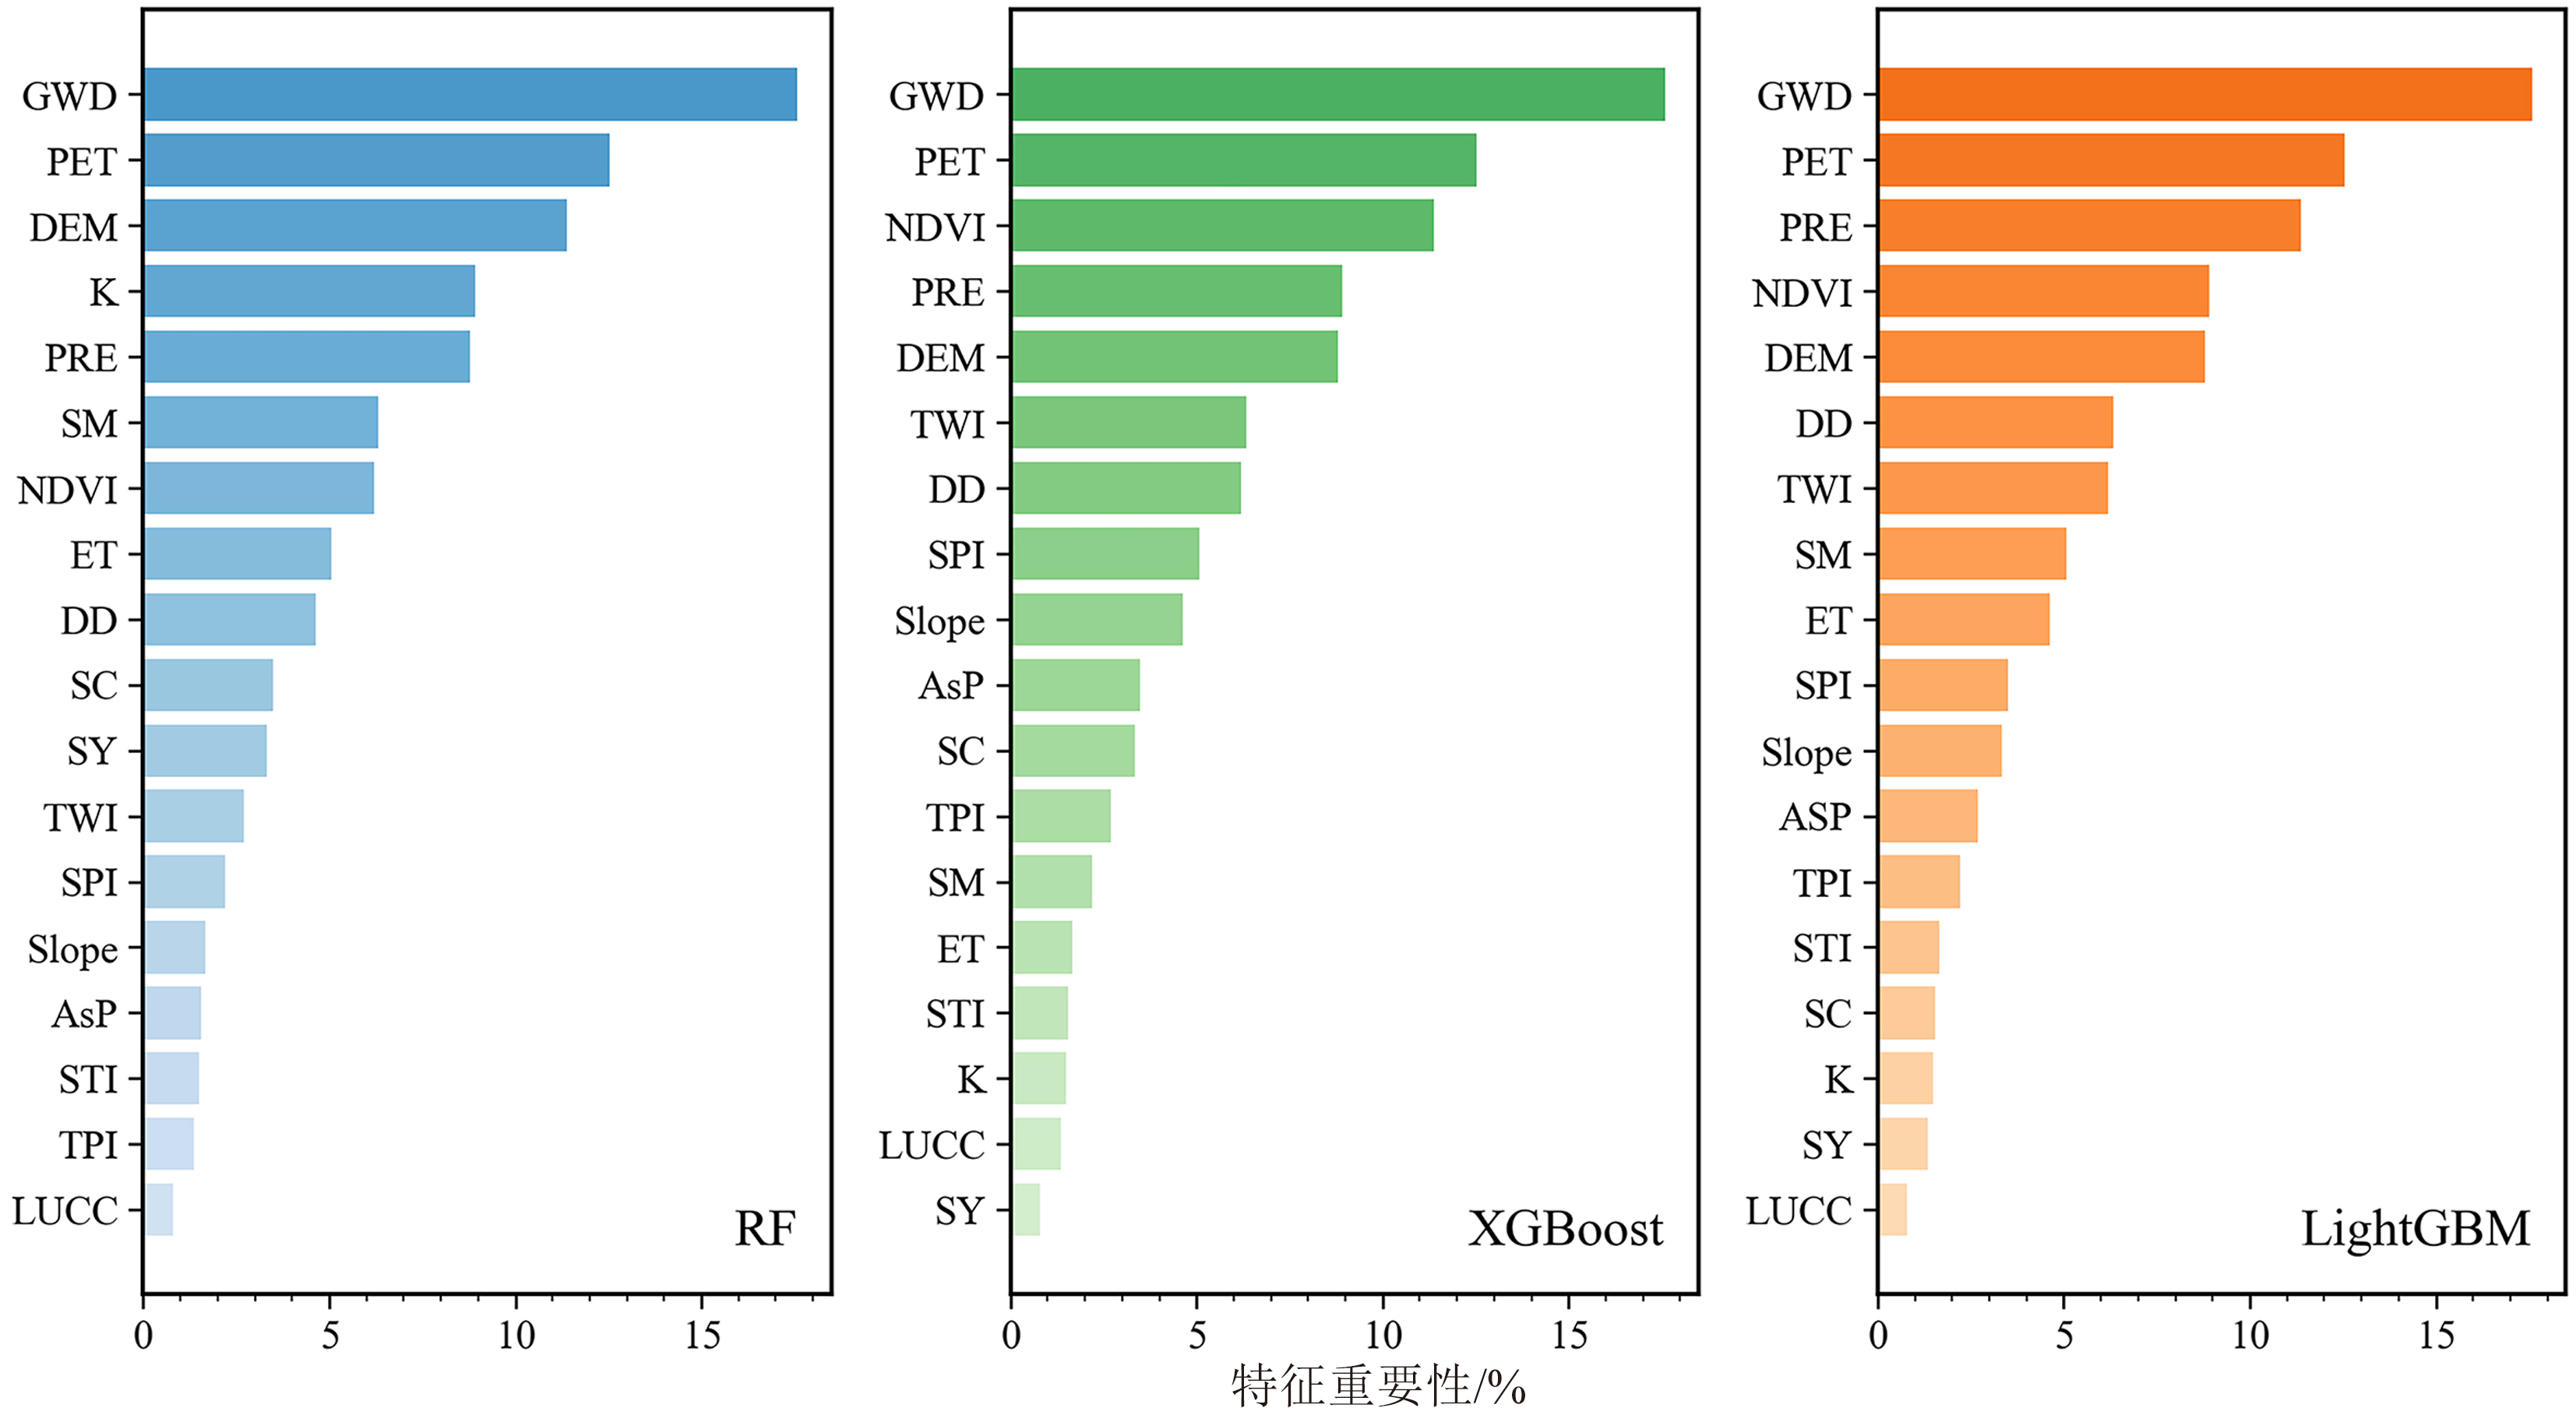
图7 3个基于树的集成模型特征重要性排序
Fig.7 The feature importance ranking of three tree-based ensemble models
| [1] |
GUO X Y, FENG Q, SI J H, et al. Identifying the origin of groundwater for water resources sustainable management in an Arid Oasis, China[J]. Hydrological Sciences Journal, 2019, 64(10): 1253-1264.
DOI URL |
| [2] | 胡汝骥, 樊自立, 王亚俊, 等. 中国西北干旱区的地下水资源及其特征[J]. 自然资源学报, 2002, 15(3): 321-326. |
| [3] | SONG Y, XUE D, MA B, et al. Farming in arid areas depletes China’s water[J]. Science, 2023, 379(6633): 651. |
| [4] | 陈亚宁, 杨青, 罗毅, 等. 西北干旱区水资源问题研究思考[J]. 干旱区地理, 2012, 35(1): 1-9. |
| [5] | 王玉洁, 秦大河. 气候变化及人类活动对西北干旱区水资源影响研究综述[J]. 气候变化研究进展, 2017, 13(5): 483-493. |
| [6] | 王贵玲, 刘志明, 刘花台, 等. 地下水潜力评价方法[J]. 水文地质工程地质, 2003, 29(1): 63-66. |
| [7] |
SOLOMON S, QUIEL F. Groundwater study using remote sensing and geographic information systems (GIS) in the central highlands of Eritrea[J]. Hydrogeology Journal, 2006, 14(6): 1029-1041.
DOI URL |
| [8] |
EL-SOROGY A S, ALHARBI T, AL-KAHTANY K, et al. Identification and validation of groundwater potential zones in Al-Madinah Al-Munawarah, Western Saudi Arabia using remote sensing and GIS techniques[J]. Water, 2024, 16(23): 3421.
DOI URL |
| [9] |
SHERBINI R A E, GHAZALA H H, AHMED M A, et al. Mapping groundwater potential zones in the Widyan Basin, Al Qassim, KSA: analytical hierarchy process-based analysis using Sentinel-2, ASTER-DEM, and conventional data[J]. Remote Sensing, 2025, 17(5): 766.
DOI URL |
| [10] |
DÍAZ-ALCAIDE S, MARTÍNEZ-SANTOS P. Review: advances in groundwater potential mapping[J]. Hydrogeology Journal, 2019, 27(7): 2307-2324.
DOI |
| [11] |
ABRAMS W, GHONEIM E, SHEW R, et al. Delineation of groundwater potential (GWP) in the northern United Arab Emirates and Oman using geospatial technologies in conjunction with Simple Additive Weight (SAW), Analytical Hierarchy Process (AHP), and Probabilistic Frequency Ratio (PFR) techniques[J]. Journal of Arid Environments, 2018, 157: 77-96.
DOI URL |
| [12] |
RAZAVI-TERMEH S V, SADEGHI-NIARAKI A, CHOI S. Groundwater potential mapping using an integrated ensemble of three bivariate statistical models with random forest and logistic model tree models[J]. Water, 2019, 11(8): 1596.
DOI URL |
| [13] | MULTANIYA A P, SINHA M K, SAHU K K, et al. Geospatial technique for the delineation of groundwater potential zones using multi-criteria-based AHP and MIF methods[J]. Water Supply, 2024, 4(24): 1024-1047. |
| [14] |
SRINIVASA RAO Y, AND JUGRAN D K. Delineation of groundwater potential zones and zones of groundwater quality suitable for domestic purposes using remote sensing and GIS[J]. Hydrological Sciences Journal, 2003, 48(5): 821-833.
DOI URL |
| [15] |
SHINDE S P, BARAI V N, GAVIT B K, et al. Assessment of groundwater potential zone mapping for semi-arid environment areas using AHP and MIF techniques[J]. Environmental Sciences Europe, 2024, 36(1): 87.
DOI |
| [16] | PRASAD P, LOVESON V J, KOTHA M, et al. Application of machine learning techniques in groundwater potential mapping along the west coast of India[J]. GIScience & Remote Sensing, 2020, 57(6): 735-752. |
| [17] |
THANH N N, THUNYAWATCHARAKUL P, NGU N H, et al. Global review of groundwater potential models in the last decade: parameters, model techniques, and validation[J]. Journal of Hydrology, 2022, 614: 128501.
DOI URL |
| [18] |
RIAZ M T, RIAZ M T, REHMAN A, et al. An integrated approach of support vector machine (SVM) and weight of evidence (WOE) techniques to map groundwater potential and assess water quality[J]. Scientific Reports, 2024, 14(1): 26186.
DOI PMID |
| [19] | SAMANTARAY S, SAHOO A, GHOSE D K. Assessment of groundwater potential using neural network: a case study[C]. 3rd International Conference on Intelligent Computing and Communication (ICICC). Singapore: Springer Singapore, 2019, 655-664. |
| [20] |
NAGHIBI S A, MORADI DASHTPAGERDI M. Evaluation of four supervised learning methods for groundwater spring potential mapping in Khalkhal region (Iran) using GIS-based features[J]. Hydrogeology Journal, 2017, 25(1): 169-189.
DOI URL |
| [21] |
ZABIHI M, POURGHASEMI H R, POURTAGHI Z S, et al. GIS-based multivariate adaptive regression spline and random forest models for groundwater potential mapping in Iran[J]. Environmental Earth Sciences, 2016, 75(8): 665.
DOI URL |
| [22] |
SACHDEVA S, KUMAR B. Comparison of gradient boosted decision trees and random forest for groundwater potential mapping in Dholpur (Rajasthan), India[J]. Stochastic Environmental Research and Risk Assessment, 2021, 35(2): 287-306.
DOI |
| [23] |
GUO X, GUI X, XIONG H, et al. Critical role of climate factors for groundwater potential mapping in arid regions: insights from random forest, XGBoost, and LightGBM algorithms[J]. Journal of Hydrology, 2023, 621: 129599.
DOI URL |
| [24] | XIONG H, GUO X, WANG Y, et al. Spatial prediction of groundwater potential by various novel boosting-based ensemble learning models in mountainous areas[J]. Geocarto International, 2023, 38(1): 1-32. |
| [25] | 汤奇成, 张捷斌. 西北干旱地区水资源与生态环境保护[J]. 地理科学进展, 2001, 24(3): 226-232. |
| [26] | 刘恒, 钟华平, 顾颖. 西北干旱内陆河区水资源利用与绿洲演变规律研究:以石羊河流域下游民勤盆地为例[J]. 水科学进展, 2001, 12(3): 378-384. |
| [27] | 马兴旺, 李保国, 吴春荣, 等. 绿洲区土地利用对地下水影响的数值模拟分析:以民勤绿洲为例[J]. 资源科学, 2002, 26(2): 49-55. |
| [28] | 马兴旺, 李保国, 吴春荣, 等. 民勤绿洲现状土地利用模式影响下地下水位时空变化的预测[J]. 水科学进展, 2003, 14(1): 85-90. |
| [29] |
贺向丽, 叶懋, 蒋雨彤. 基于潜水-承压水模型的民勤绿洲地下水位预测[J]. 西南石油大学学报(自然科学版), 2015, 37(3): 168-173.
DOI |
| [30] | 王晓玮, 邵景力, 甘雨. 基于数值模拟的西北地下水总量控制指标确定研究[J]. 水文地质工程地质, 2017, 44(3): 12-18. |
| [31] | 马金辉, 韩金华, 张艳林. 近10 a来民勤盆地地下水埋深的空间异质性分析[J]. 干旱区地理, 2013, 36(1): 1-7. |
| [32] | 王贵忠, 罗星罡, 徐洲元, 等. 民勤地区水资源特征分析研究[J]. 中国水土保持, 2014(7): 21-22. |
| [33] | 王晓玮, 邵景力, 王卓然, 等. 西北地区地下水水量-水位双控指标确定研究:以民勤盆地为例[J]. 水文地质工程地质, 2020, 47(2): 17-24. |
| [34] |
NIU Z, HE H, ZHU G, et al. An increasing trend in the ratio of transpiration to total terrestrial evapotranspiration in China from 1982 to 2015 caused by greening and warming[J]. Agricultural and Forest Meteorology, 2019, 279: 107701.
DOI URL |
| [35] | 彭守璋. 中国1km逐月潜在蒸散发数据集(1901—2023)[Z]. 国家青藏高原科学数据中心, 2024. |
| [36] |
YANG J, DONG J, XIAO X, et al. Divergent shifts in peak photosynthesis timing of temperate and alpine grasslands in China[J]. Remote Sensing of Environment, 2019, 233: 111395.
DOI URL |
| [37] |
YANG J, HUANG X. 30 m annual land cover and its dynamics in China from 1990 to 2019[J]. Earth System Science Data, 2021, 13(8): 3907-3925.
DOI URL |
| [38] | 宋沛林, 张永强, 姚盼盼, 等. 中国1千米分辨率逐日全天候地表土壤水分数据集(2003—2023)[Z]. 国家青藏高原科学数据中心, 2024. |
| [39] | 李海涛, 许学工, 肖笃宁. 民勤绿洲水资源利用分析[J]. 干旱区研究, 2007, 24(3): 287-295. |
| [40] | 李元红, 王以兵. 石羊河流域高效节水灌溉与农业种植结构调整[J]. 中国水利, 2013, 48(5): 52-54. |
| [41] | 郑永山, 杨正华. 甘肃省石羊河流域地下水管理对策分析[J]. 地下水, 2016, 38(5): 119-121. |
| [42] | 柴会霞, 谭立海, 潘加朋. 气候变化背景下黑河流域水文及水资源特征[J]. 水利水电技术(中英文), 2023, 54(增刊2): 98-104. |
| [1] | 文章, 李一鸣, 郭绪磊, 万坦, 罗清树, 周宏. 葛洲坝库区裂隙河岸地表水-地下水交互特征[J]. 地学前缘, 2026, 33(1): 1-13. |
| [2] | 董艳辉, 王礼恒, 张倩, 周志超, 文冬光, 李守定, 万力. 深部水文地质学裂隙渗流研究挑战与进展[J]. 地学前缘, 2026, 33(1): 296-312. |
| [3] | 许林, 马海春, 王京平, 张庆, 黄逸航, 钱家忠, 王万林. 高地应力高温条件裂隙介质地下水非线性渗流研究进展[J]. 地学前缘, 2026, 33(1): 313-327. |
| [4] | 乔小娟, 罗承可, 柴新宇, 于文瑾. 基于机器学习的岩溶裂隙空间分布预测研究:以北京房山为例[J]. 地学前缘, 2026, 33(1): 405-418. |
| [5] | 康金正, 莫绍星, 康学远, 党婧萱, 程迟吉太, 徐培杰, 施小清. 机器学习在地下水科学中的前沿进展与挑战[J]. 地学前缘, 2026, 33(1): 483-499. |
| [6] | 何晓, 牛花朋, 赵贤, 周浩彦, 林伟峻, 张关龙, 孟涛, 穆星. 基于数值模拟表征岩石组构对裂缝性储层发育影响程度的机理研究:以济阳坳陷花岗质岩石为例[J]. 地学前缘, 2025, 32(5): 361-376. |
| [7] | 娄渝明, 康旭, 赖渊平, 龚建生, 周涤非, 窦世荣, 樊炳良, 丁帅, 舒德福, 陈根. 隐式建模和机器学习算法在西藏巨龙斑岩型铜钼矿床三维成矿预测中的应用研究[J]. 地学前缘, 2025, 32(5): 440-455. |
| [8] | 刘美玉, 吴玮, 王汇, 罗伟儿, 吴娟娟, 郭旭东. 训练集规模优先于相似性:机器学习模型在积石山地震滑坡预测中的比较研究[J]. 地学前缘, 2025, 32(5): 466-483. |
| [9] | 叶舒婉, 侯卫生, 杨玠, 汪海城, 白芸, 王永志. 三维地质智能建模研究进展[J]. 地学前缘, 2025, 32(4): 182-198. |
| [10] | 肖凡, 杨华清, 唐奥, 黄旋财, 王翠翠. 基于机器学习与多源数据融合的东天山戈壁沙漠覆盖区中-酸性侵入岩岩性填图[J]. 地学前缘, 2025, 32(4): 199-212. |
| [11] | 肖克炎, 李程, 唐瑞, 王瑶, 孙莉, 柳炳利, 樊铭静. 大数据智能预测评价[J]. 地学前缘, 2025, 32(4): 20-37. |
| [12] | 张雨飞, 张杨, 吉俊杰, 成秋明. 基于机器学习方法的南海洋壳大地热流预测[J]. 地学前缘, 2025, 32(4): 235-249. |
| [13] | 简富源, 张子鸣, 董岳霖, 张文璟, 郝风云, 王一鸣, 王宇, 张振杰. 基于多重分形与随机森林的新疆哈巴河金矿成矿预测[J]. 地学前缘, 2025, 32(4): 78-94. |
| [14] | 李金明, 张杨, 成秋明. 基于机器学习与垂向分层建模联合驱动的华北克拉通地温梯度空间分布预测[J]. 地学前缘, 2025, 32(4): 291-302. |
| [15] | 胡景宏, 廖松泽, 蔡益栋, 芦俊. 深部页岩储层压裂裂缝扩展均匀性研究[J]. 地学前缘, 2025, 32(4): 471-482. |
| 阅读次数 | ||||||
|
全文 |
|
|||||
|
摘要 |
|
|||||