地学前缘 ›› 2024, Vol. 31 ›› Issue (1): 486-499.DOI: 10.13745/j.esf.sf.2024.1.5
江南萱1,2( ), 燕青1,3, 王会军1,3,*()
收稿日期:2023-11-02
修回日期:2023-12-28
出版日期:2024-01-25
发布日期:2024-01-25
通信作者:
*王会军(1964—),男,教授,博士生导师,中国科学院院士,主要从事气候动力学、气候变化和气候预测理论等方面的研究工作。E-mail: 作者简介:江南萱(1997—),女,博士研究生,主要从事古气候模拟研究。E-mail: jiangnanxuan19@mails.ucas.ac.cn
基金资助:
JIANG Nanxuan1,2(), YAN Qing1,3, WANG Huijun1,3,*()
Received:2023-11-02
Revised:2023-12-28
Online:2024-01-25
Published:2024-01-25
摘要:
采用水平分辨率约1°的地球系统模式CESM,本研究开展了末次间冰期129~124 ka的瞬变模拟试验(TGCS-LIG)和127 ka的平衡态切片模拟试验(127ka-LIG),量化了数值试验方案对模拟的末次间冰期全球气候的影响,以期加深理解造成模拟结果与重建数据之间分歧的可能原因。TGCS-LIG试验和127ka-LIG试验均表明:末次间冰期全球年平均温度较工业革命前低,降温幅度分别为0.4 ℃和0.2 ℃;在夏季,北半球升温(1.2/1.5 ℃),而南半球降温(0.9/0.7 ℃)。就年降水而言,末次间冰期北半球季风区降水增加,南半球季风区降水减少,但存在显著的区域差异。与重建数据相比,TGCS-LIG试验和127ka-LIG试验的模拟-数据符号一致性与均方根误差均相近,但127ka-LIG试验模拟效果略好。TGCS-LIG试验与重建的全球年平均(夏季)海温符号一致性为34.9%~44.7%(36.8%~42.5%),较127ka-LIG偏差约2%~4%(约5%~7%);均方根误差为2.9~3.2 ℃(2.9~3.4 ℃),较127ka-LIG试验偏差小于约0.1 ℃。对于全球年平均降水,TGCS-LIG试验与重建数据的符号一致性为63.8%,略高于127ka-LIG试验(63.1%)。相较于模拟和重建之间的绝对偏差而言,数值试验方案对于改进两者分歧的作用十分有限。需要注意的是,TGCS-LIG试验表明:末次间冰期全球关键气候模态的年际变率在129~124 ka间存在显著的内部变化,其中ENSO年际变率随时间逐渐增强,北半球环状模与南半球环状模的年际变率呈现千年尺度波动的特征;而127ka-LIG试验无法刻画气候模态的时间演变特征。总之,本文研究结果表明,采用平衡模拟试验或是瞬变模拟试验并不是造成末次间冰期模拟-数据分歧的主要原因,但开展高时空分辨率的瞬变模拟试验对研究末次间冰期气候变率具有重要的科学价值。
中图分类号:
江南萱, 燕青, 王会军. 末次间冰期全球气候瞬变模拟与平衡态模拟的对比研究[J]. 地学前缘, 2024, 31(1): 486-499.
JIANG Nanxuan, YAN Qing, WANG Huijun. Transient and time-slice simulations of global climate change during the Last Interglacial: Model-model and model-data comparisons[J]. Earth Science Frontiers, 2024, 31(1): 486-499.
| 模式驱动因子 | 130 ka (130ka-LIG) | 127 ka (127ka-LIG) | 1950 A.D. (PI) | |
|---|---|---|---|---|
| 轨道参数 | 偏心率 | 0.038 209 | 0.039 378 | 0.016 724 |
| 倾角 | 24.242° | 24.040° | 23.466° | |
| 近日点-180 | 228.32° | 275.41° | 102.04° | |
| 温室气体 | CO2浓度 | 258×10-6 | 275×10-6 | 280×10-6 |
| CH4浓度 | 518×10-9 | 685×10-9 | 760×10-9 | |
| N2O浓度 | 238×10-9 | 255×10-9 | 270×10-9 | |
| 其余温室气体 | 0 | 0 | PI | |
表1 130ka-LIG、127ka-LIG与工业革命前试验采用的外强迫
Table 1 External forcings used in the 130ka-LIG, 127ka-LIG and PI experiments
| 模式驱动因子 | 130 ka (130ka-LIG) | 127 ka (127ka-LIG) | 1950 A.D. (PI) | |
|---|---|---|---|---|
| 轨道参数 | 偏心率 | 0.038 209 | 0.039 378 | 0.016 724 |
| 倾角 | 24.242° | 24.040° | 23.466° | |
| 近日点-180 | 228.32° | 275.41° | 102.04° | |
| 温室气体 | CO2浓度 | 258×10-6 | 275×10-6 | 280×10-6 |
| CH4浓度 | 518×10-9 | 685×10-9 | 760×10-9 | |
| N2O浓度 | 238×10-9 | 255×10-9 | 270×10-9 | |
| 其余温室气体 | 0 | 0 | PI | |

图1 130~123 ka的(a)CO2浓度(单位:10-6)、(b)CH4浓度(单位:10-9)、(c)N2O浓度(单位:10-9)与(d)65°N的7月大气顶太阳辐射演变(单位:W/m2)
Fig.1 The evolution of (a) CO2 (units: 10-6), (b) CH4 (units: 10-9), (c) N2O (units: 10-9), and July insolation at 65°N at the top of atmosphere (units: W/m2) during 130-123 ka

图2 (a,d)TGCS-LIG试验末次间冰期(129~124 ka)与工业革命前的(a)年平均表面温度和(b)夏季表面温度异常(单位:℃)。(b,e)127ka-LIG试验末次间冰期(127 ka)与工业革命前的(b)年平均表面温度和(e)夏季表面温度异常(单位:℃)。(c,f)TGCS-LIG试验与127ka-LIG试验的(c)年平均表面温度和(f)夏季表面温度异常(单位:℃)。 图上打点表示重建资料指示末次间冰期偏暖(红色)与偏冷(蓝色)。图中方形、三角形、圆形和十字标志分别表示重建数据来自Turney等[1]、Hoffman等[2]、Capron等[18,47]和Brewer等[48]。
Fig.2 Anomaly of (a, b) annual and (b, e) summer surface temperature during the Last Interglacial relative to the preindustrial based on (a, d) TGCS-LIG experiment (shade), (b, e) 127ka-LIG experiment (shade) and reconstructions from Turney et al.[1] (square), Capron et al.[18,47] (circle), Hoffman et al.[2] (triangle) and Brewer et al.[48] (cross) (units: ℃). (c, f) Difference of (c) annual and (f) summer surface temperature between TGCS-LIG and 127ka-LIG (units: ℃). The red and blue markers represent reconstructed warmer and colder states during the Last Interglacial, respectively.
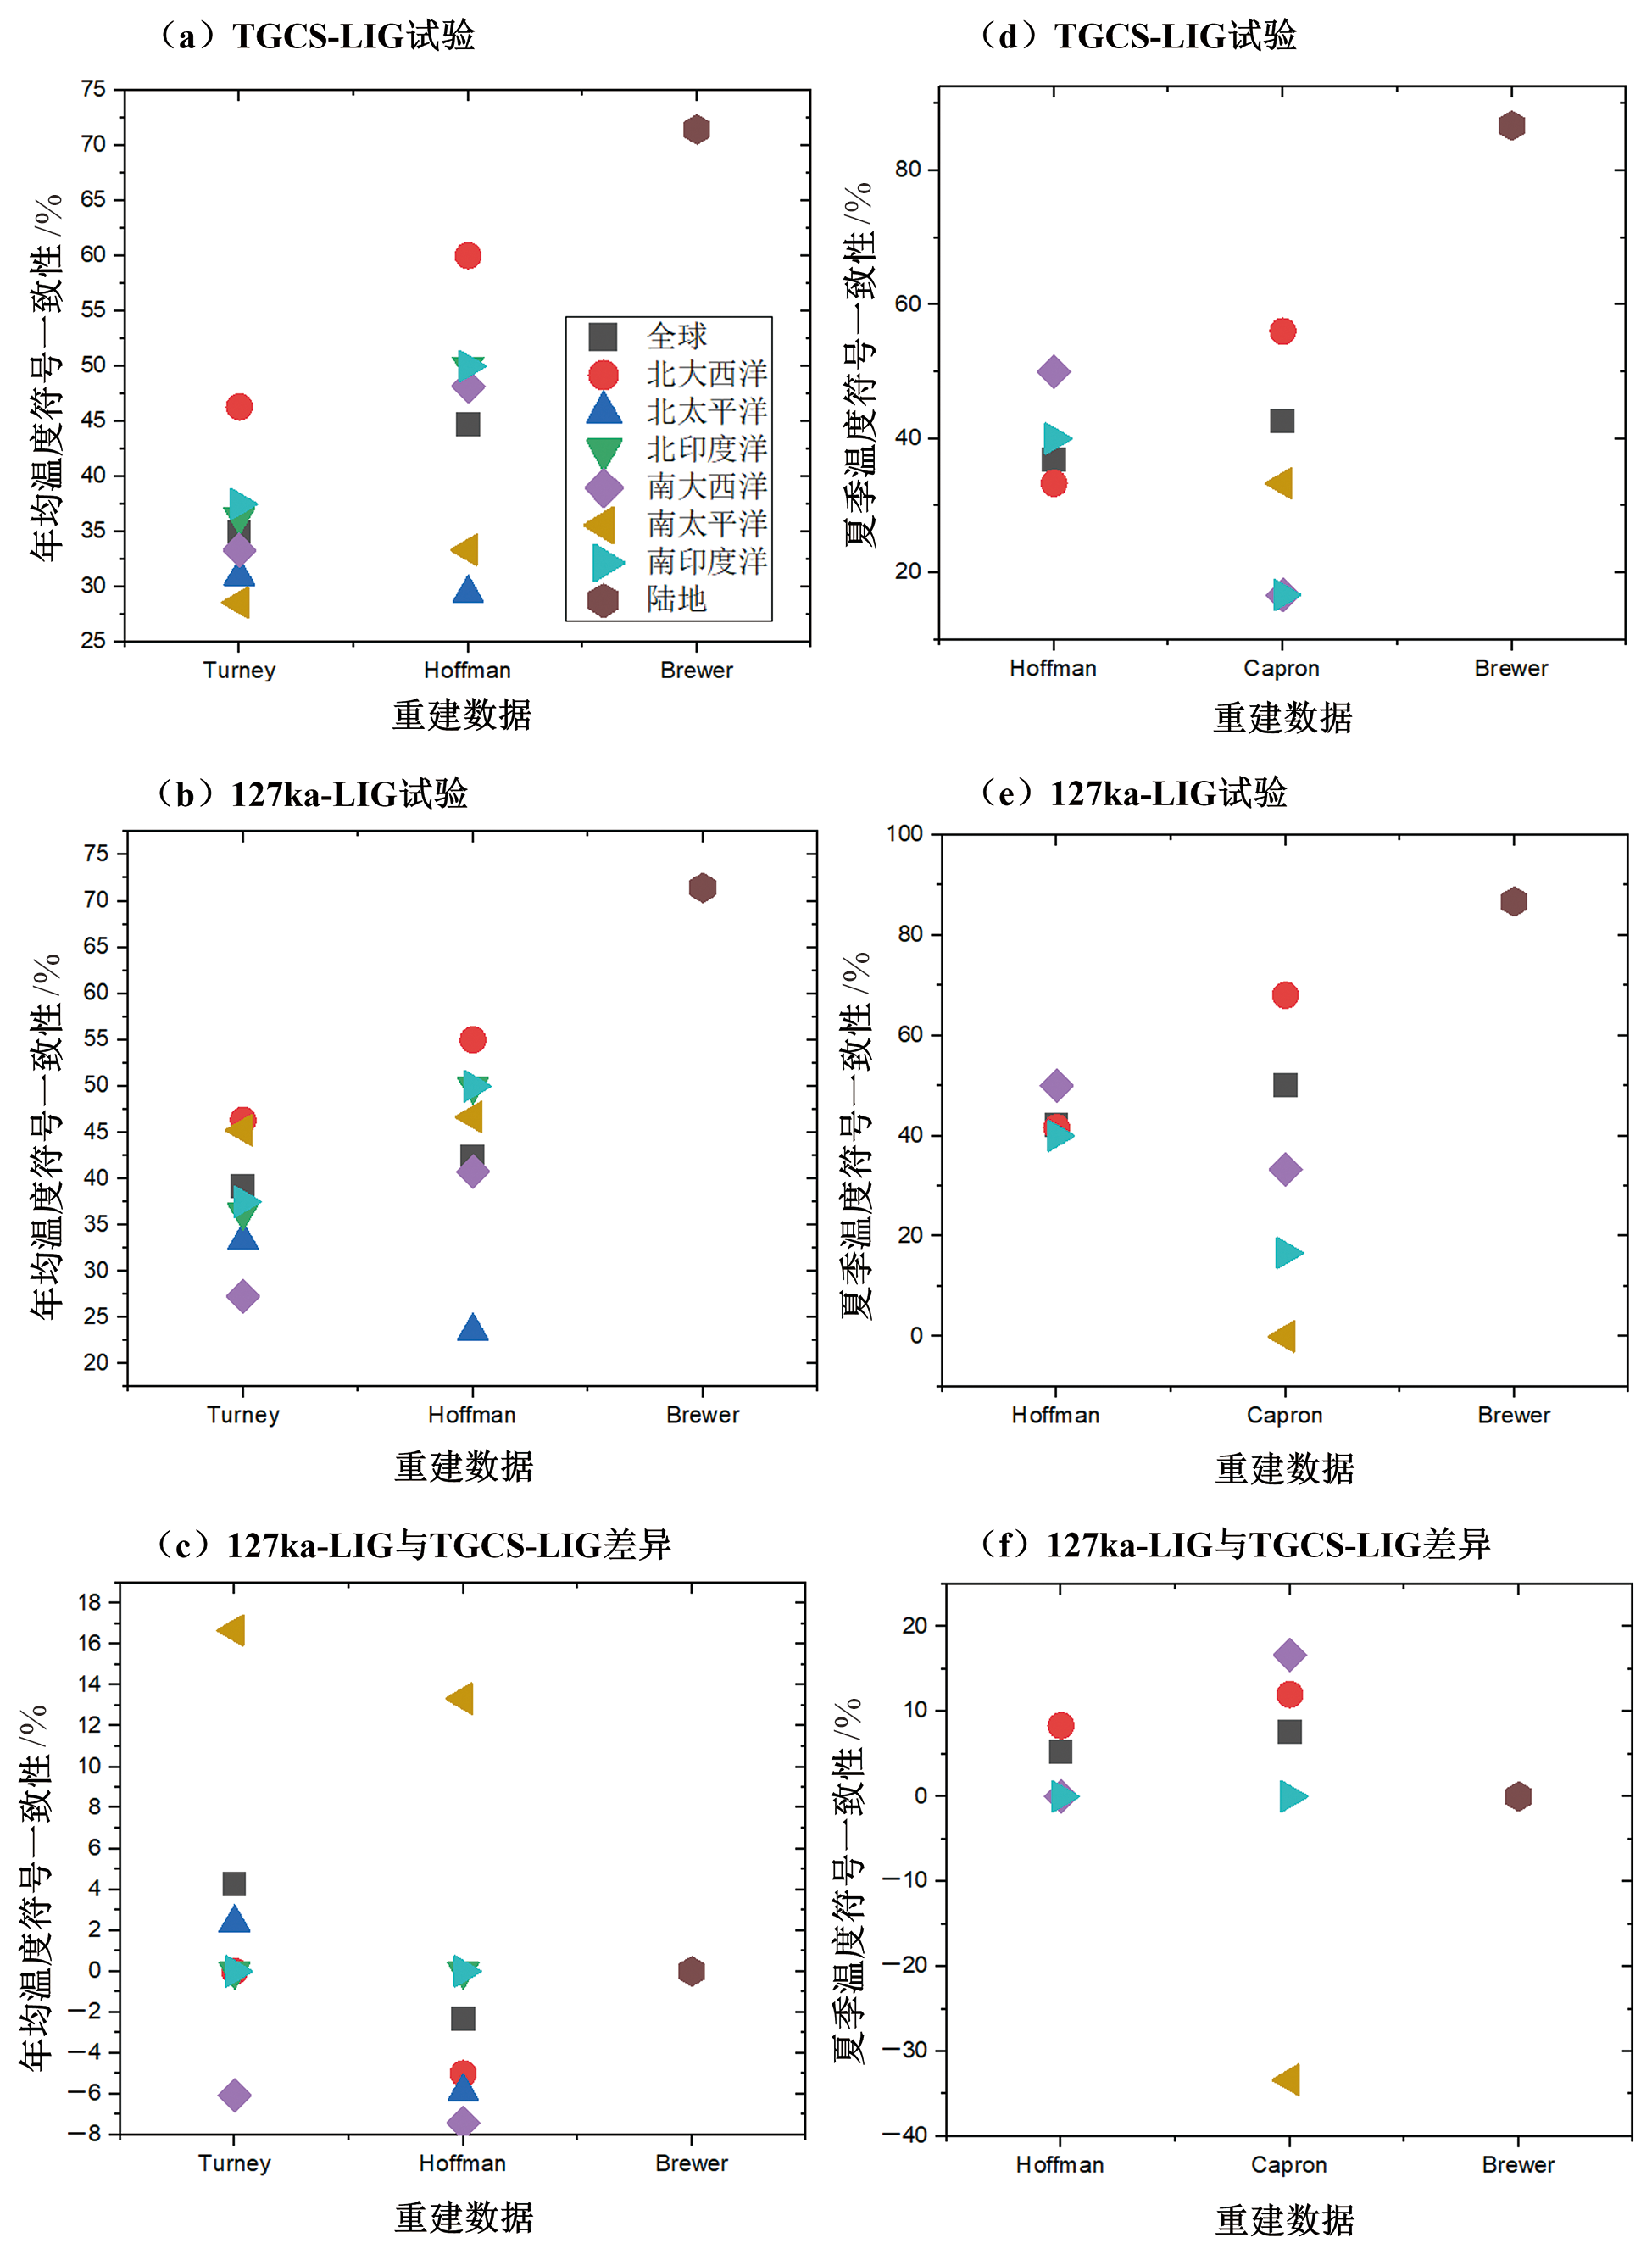
图3 (a,d)TGCS-LIG与重建数据的(a)年平均温度与(d)夏季温度的符号一致性(单位:%)。(b,e)127ka-LIG与重建数据的(b)年平均温度与(e)夏季温度的符号一致性(单位:%)。(c,f)127ka-LIG与TGCS-LIG的(c)年平均温度与(b)夏季温度的符号一致性差异(单位:%)。北大西洋经纬度范围为0°~90°N,90°W~10°E;北太平洋经纬度范围为0°~90°N,100°E~90°W;北印度洋范围为0°~90°N,60°~100°E;南大西洋范围为0°~90°S,60°W~30°E;南太平洋范围为0°~90°S,110°E~60°W;南印度洋范围为0°~90°S,30°E~110°E
Fig.3 (a, d) Hit rate of (a) annual and (d) summer surface temperature between TGCS-LIG and reconstructions (units: %). (b, e) Hit rate of (b) annual and (e) summer surface temperature between TGCS-LIG and reconstructions (units: %). (c, f) Difference in hit rate of (c) annual and (f) summer surface temperature between 127ka-LIG and TGCS-LIG (units: %). The North Atlantic was over 0-90°N, 90°W-10°E. The North Pacific was over 0-90°N, 100°E-90°W. The North Indian was over 0-90°N, 60°-100°E. The South Atlantic was over 0-90°S, 60°W-30°E. The South Pacific was over 0-90°S, 110°E-60°W. The South Indian was over 0-90°S, 30°E-110°E.

图4 (a,d)TGCS-LIG与重建数据的(a)年平均温度与(d)夏季温度的均方根误差。(b,e)127ka-LIG与重建数据的(b)年平均温度与(e)夏季温度的均方根误差。(c,f)127ka-LIG与TGCS-LIG的(c)年平均温度与(b)夏季温度的均方根误差差异。北大西洋经纬度范围为0°~90°N,90°W~10°E;北太平洋经纬度范围为0°~90°N,100°E~90°W;北印度洋范围为0°~90°N,60°~100°E;南大西洋范围为0°~90°S,60°W~30°E;南太平洋范围为0°~90°S,110°E-60°W;南印度洋范围为0°~90°S,30°E~110°E
Fig.4 (a, d) Root mean square error of (a) annual and (d) summer surface temperature between TGCS-LIG and reconstructions (units: ℃). (b, e) Root mean square error of (b) annual and (e) summer surface temperature between TGCS-LIG and reconstructions (units: ℃). (c, f) Difference in root mean square error of (c) annual and (f) summer surface temperature between 127ka-LIG and TGCS-LIG (units: ℃). The North Atlantic was over 0-90°N, 90°W-10°E. The North Pacific was over 0-90°N, 100°E-90°W. The North Indian was over 0-90°N, 60°-100°E. The South Atlantic was over 0-90°S, 60°W-30°E. The South Pacific was over 0-90°S, 110°E-60°W. The South India was over 0-90°S, 30°E-110°E.

图5 (a)TGCS-LIG试验末次间冰期与工业革命前的年降水异常(单位:mm/d)。(b)TGCS-LIG试验与127ka-LIG试验的年降水差异(单位:mm/d)。(c)TGCS-LIG试验与重建数据的年平均降水的符号一致性(单位:%)。(d)127ka-LIG试验与重建数据的年平均降水的符号一致性(单位:%)。 图(a)打点表示重建资料指示末次间冰期降水偏多(蓝色)、偏少(红色)与无明显变化(白色)。
Fig.5 (a) Anomaly of annual precipitation during the Last Interglacial relative to the preindustrial based on TGCS-LIG (units: mm/d). (b) Difference of annual precipitation between TGCS-LIG and 127ka-LIG (units: mm/d). (c) Hit rate of annual precipitation between TGCS-LIG and reconstructions (units: %). (d) Hit rate of annual precipitation between 127ka-LIG and reconstructions (units: %). The blue, red, and white markers in (a) represent reconstructed increased precipitation, decreased precipitation, and no significant change during the Last Interglacial, respectively.

图6 TGCS-LIG试验(紫色)、127ka-LIG试验(红色)和PI试验(蓝色)的(a)Niño3指数(单位:℃)、(b)北半球环状模指数(NAM,无单位)与(c)南半球环状模指数(SAM,无单位)的年际变率
Fig.6 Interannual variability of the (a) Niño3 index (units: ℃), (b) Northern Hemisphere Annular Mode (NAM) index (unitless), and (c) Southern Hemisphere Annular Mode (SAM) index (unitless) based on the TGCS-LIG experiment at 1 ka interval (purple), 127ka-LIG experiment (red) and PI experiment (blue)
| [1] |
TURNEY C S M, JONES R, MCKAY N P, et al. A global mean sea-surface temperature dataset for the Last Interglacial (129-116 kyr) and contribution of thermal expansion to sea-level change[J]. Earth System Science Data, 2020, 12(4): 3341-3356.
DOI URL |
| [2] |
HOFFMAN J S, CLARK P U, PARNELL A C, et al. Regional and global sea-surface temperatures during the last interglaciation[J]. Science, 2017, 355: 276-279.
DOI PMID |
| [3] |
DUTTON A, CARLSON A E, LONG A J, et al. Sea-level rise due to polar ice-sheet mass loss during past warm periods[J]. Science, 2015, 349(6244): aaa4019.
DOI URL |
| [4] |
PAUSATA F S R, GAETANI M, MESSORI G, et al. The greening of the Sahara: past changes and future implications[J]. One Earth, 2020, 2(3): 235-250.
DOI URL |
| [5] | GULEV S K, THORNE P W, AHN J, et al. Changing state of the climate system[R]// MASSON-DELMOTTE V, ZHAI P,PIRANI S, et al. Climate change 2021:the physical science basis. Contribution of working group I to the Sixth Assessment Report of the Intergovernmental Panel on Climate Change. Cambridge: Cambridge University Press, 2021: 287-422. |
| [6] |
OTTO-BLIESNER B L, BRADY E C, ZHAO A, et al. Large-scale features of Last Interglacial climate: results from evaluating the lig127k simulations for the Coupled Model Intercomparison Project (CMIP6)-Paleoclimate Modeling Intercomparison Project (PMIP4)[J]. Climate of the Past, 2021, 17: 63-94.
DOI URL |
| [7] |
SCUSSOLINI P, BAKKER P, GUO C, et al. Agreement between reconstructed and modeled boreal precipitation of the Last Interglacial[J]. Science Advances, 2019, 5: eaax7047.
DOI URL |
| [8] |
KAGEYAMA M, SIME L C, SICARD M, et al. A multi-model CMIP6-PMIP4 study of Arctic sea ice at 127 ka: sea ice data compilation and model differences[J]. Climate of the Past, 2021, 17: 37-62.
DOI URL |
| [9] |
JIANG N X, YAN Q, WANG H J. Deciphering the variations and mechanisms of the westerly jets across the Northern Hemisphere during the Last Interglacial based on PMIP4 models[J]. Climate Dynamics, 2022, 58: 3279-3295.
DOI |
| [10] | 江南萱, 燕青, 王会军. 末次间冰期亚洲干旱区干湿变化的模拟研究[J]. 大气科学学报, 2023, 46(1): 55-68. |
| [11] | JIANG N X, YAN Q, WANG H J. Intensified atmospheric branch of the hydrological cycle over the Tibetan Plateau during the Last Interglacial from a Dynamical Downscaling Perspective[J]. Journal of Geophysical Research: Atmospheres, 2022, 127(15): e2022JD036470. |
| [12] |
SANCHEZ GONI M F, BAKKER P, DESPRAT S, et al. European climate optimum and enhanced Greenland melt during the Last Interglacial[J]. Geology, 2012, 40(7): 627-630.
DOI URL |
| [13] |
LI H, RENSSEN H, ROCHE D M. Modeling climate-vegetation interactions during the last interglacial: the impact of biogeophysical feedbacks in North Africa[J]. Quaternary Science Reviews, 2020, 249: 106609.
DOI URL |
| [14] |
LI H, RENSSEN H, ROCHE D M. Comparison of the Green-to-desert Sahara transitions between the Holocene and the Last Interglacial[J]. Climate of the Past, 2022, 18: 2303-2319.
DOI URL |
| [15] | YAN Q, KORTY R, WEI T, et al. A westward shift in tropical cyclone potential intensity and genesis regions in the north Atlantic during the Last Interglacial[J]. Geophysical Research Letters, 2021, 48(12): e2021GL093946. |
| [16] | JIIANG N X, YAN Q, WANG H J, et al. Earlier onset and shortened Meiyu Season during the Last Interglacial based on dynamical downscaling simulations[J]. Geophysical Research Letters, 2022, 49(24): e2022GL101048. |
| [17] |
JIANG N X, YAN Q, WANG H J. General characteristics of climate change over China and associated dynamic mechanisms during the Last Interglacial based on PMIP4 simulations[J]. Global and Planetary Change, 2021, 208: 103700.
DOI URL |
| [18] |
CAPRON E, GOVIN A, FENG R, et al. Critical evaluation of climate syntheses to benchmark CMIP6/PMIP4 127 ka Last Interglacial simulations in the high-latitude regions[J]. Quaternary Science Reviews, 2017, 168: 137-150.
DOI URL |
| [19] | 张琼, 陈婕. 末次间冰期127 ka时期植被反馈增强东亚夏季风降水的数值模拟研究[J]. 第四纪研究, 2020, 40(6): 1499-1512. |
| [20] |
O’ISHI R, CHAN W L, ABE-OUCHI A, et al. PMIP4/CMIP6 last interglacial simulations using three different versions of MIROC: importance of vegetation[J]. Climate of the Past, 2021, 17(1): 21-36.
DOI URL |
| [21] |
MERZ N, GFELLER G, BORN A, et al. Influence of ice sheet topography on Greenland precipitation during the Eemian interglacial[J]. Journal of Geophysical Research: Atmospheres, 2014, 119(18): 10749-10768.
DOI URL |
| [22] |
PFEIFFER M, LOHMANN G. Greenland Ice Sheet influence on Last Interglacial climate: global sensitivity studies performed with an atmosphere-ocean general circulation model[J]. Climate of the Past, 2016, 12(6): 1313-1338.
DOI URL |
| [23] |
ZHANG Z, JANSEN E, SOBOLOWSKI S P, et al. Atmospheric and oceanic circulation altered by global mean sea-level rise[J]. Nature Geoscience, 2023, 16(4): 321-327.
DOI |
| [24] |
NIKOLOVA I, YIN Q, BERGER A, et al. The last interglacial (Eemian) climate simulated by LOVECLIM and CCSM3[J]. Climate of the Past, 2013, 9(4): 1789-1806.
DOI URL |
| [25] |
PEDERSEN R A, LANGEN P L, VINTHER B M. The last interglacial climate: comparing direct and indirect impacts of insolation changes[J]. Climate Dynamics, 2016, 48(9/10): 3391-3407.
DOI URL |
| [26] | TIMM O, TIMMERMANN A, ABE-OUCHI A, et al. On the definition of seasons in paleoclimate simulations with orbital forcing[J]. Paleoceanography, 2008, 23(2): PA221. |
| [27] |
KUBATZKI C, MONTOYA M, RAHMSTORF S, et al. Comparison of the last interglacial climate simulated by a coupled global model of intermediate complexity and an AOGCM[J]. Climate Dynamics, 2000, 16: 799-814.
DOI URL |
| [28] |
MONTOYA M, STORCH H, CROWLEY S F. Climate simulation for 125 kyr BP with a coupled ocean-atmosphere general circulation model[J]. Journal of Climate, 2000, 13: 1057-1072.
DOI URL |
| [29] |
MONTOYA M, CROWLEY T J, VON STORCH H. Temperatures at the last interglacial simulated by a coupled ocean-atmosphere climate model[J]. Paleoceanography, 1998, 13(2): 170-177.
DOI URL |
| [30] |
BAKKER P, STONE E J, CHARBIT S, et al. Last interglacial temperature evolution-a model inter-comparison[J]. Climate of the Past, 2013, 9(2): 605-619.
DOI URL |
| [31] |
YIN Q, WU Z, BERGER A, et al. Insolation triggered abrupt weakening of Atlantic circulation at the end of interglacials[J]. Science, 2021, 373: 1035-1040.
DOI PMID |
| [32] | SOMMERS A N, OTTO-BLIESNER B L, LIPSCOMB W H, et al. Retreat and regrowth of the greenland ice sheet during the Last Interglacial as simulated by the CESM2-CISM2 coupled climate-ice sheet model[J]. Paleoceanography and Paleoclimatology, 2021, 36(12): e2021PA004272. |
| [33] |
BAKKER P, RENSSEN H. Last interglacial model-data mismatch of thermal maximum temperatures partially explained[J]. Climate of the Past, 2014, 10(4): 1633-1644.
DOI URL |
| [34] |
VARMA V, PRANGE M, SCHULZ M. Transient simulations of the present and the last interglacial climate using the Community Climate System Model version 3: effects of orbital acceleration[J]. Geoscientific Model Development, 2016, 9(11): 3859-3873.
DOI URL |
| [35] |
HURRELL J W, HOLLAND M M, GENT P R, et al. The community earth system model: a framework for collaborative research[J]. Bulletin of the American Meteorological Society, 2013, 94(9): 1339-1360.
DOI URL |
| [36] | OTTO-BLIESNER B L, BRADY E C, TOMAS R A, et al. A comparison of the CMIP6 midHolocene and lig127k simulations in CESM2[J]. Paleoceanography and Paleoclimatology, 2020, 35(11): e2020PA003957. |
| [37] |
LI X, HU Y, GUO J, et al. A high-resolution climate simulation dataset for the past 540 million years[J]. Scientific Data, 2022, 9(1): 371.
DOI PMID |
| [38] |
KIEHL J T, ZARZYCKI C M, SHIELDS C A, et al. Simulated changes to tropical cyclones across the Paleocene-Eocene Thermal Maximum (PETM) boundary[J]. Palaeogeography, Palaeoclimatology, Palaeoecology, 2021, 572: 110421.
DOI URL |
| [39] |
BERGER A L. Long-term variations of daily insolation and Quaternary climatic changes[J]. Journal of the Atmospheric Sciences, 1978, 35: 2362-2367.
DOI URL |
| [40] |
BAZIN L, LANDAIS A, LEMIEUX B, et al. An optimized multi-proxy, multi-site Antarctic ice and gas orbital chronology (AICC2012): 120-800 ka[J]. Climate of the Past, 2013, 9: 1715-1731.
DOI URL |
| [41] |
BEREITER B, EGGLESTON S, SCHMITT J, et al. Revision of the EPICA Dome C CO2 record from 800 to 600 kyr before present[J]. Geophysical Research Letters, 2015, 42: 542-549.
DOI URL |
| [42] |
SCHILT A, BAUMGARTNER M, BLUNIER T, et al. Glacial-interglacial and millennial-scale variations in the atmospheric nitrous oxide concentration during the last 800 000 years[J]. Quaternary Science Reviews, 2010, 29: 182-192.
DOI URL |
| [43] |
SCHILT A, BAUMGARTNER M, SCHWANDER J, et al. Atmospheric nitrous oxide during the last 140 000 years[J]. Earth and Planetary Science Letters, 2010, 300: 33-43.
DOI URL |
| [44] |
SCHNEIDER R, SCHMITT J, KÖHLER P, et al. A reconstruction of atmospheric carbon dioxide and its stable carbon isotopic composition from the penultimate glacial maximum to the last glacial inception[J]. Climate of the Past, 2013, 9(6): 2507-2523.
DOI URL |
| [45] | CAPRON E, GOVIN A, BAKKER P, et al. Paving the road for improved integrative investigations of past Warm Extremes[J]. Pages Magazine: Workshop Report, 2016, 24(1): 34. |
| [46] |
KÖHLER P, NEHRBASS-AHLES C, SCHMITT J, et al. A 156 kyr smoothed history of the atmospheric greenhouse gases CO2, CH4, and N2O and their radiative forcing[J]. Earth System Science Data, 2017, 9(1): 363-387.
DOI URL |
| [47] |
CAPRON E, GOVIN A, STONE E J, et al. Temporal and spatial structure of multi-millennial temperature changes at high latitudes during the Last Interglacial[J]. Quaternary Science Reviews, 2014, 103: 116-133.
DOI URL |
| [48] |
BREWER S, GUIOT J, SÁNCHEZ-GOÑI M F, et al. The climate in Europe during the Eemian: a multi-method approach using pollen data[J]. Quaternary Science Reviews, 2008, 27(25/26): 2303-2315.
DOI URL |
| [49] |
SHACKLETON N J, SÁNCHEZ-GOÑI M F, PAILLER D, et al. Marine isotope substage 5e and the Eemian Interglacial[J]. Global and Planetary Change, 2003, 36(3): 151-155.
DOI URL |
| [50] |
SÁNCHEZ-GOÑI M F, LANDAIS A, FLETCHER W J, et al. Contrasting impacts of Dansgaard-Oeschger events over a western European latitudinal transect modulated by orbital parameters[J]. Quaternary Science Reviews, 2008, 27: 1136-1151.
DOI URL |
| [51] |
BROWN J R, BRIERLEY C M, AN S I, et al. Comparison of past and future simulations of ENSO in CMIP5/PMIP3 and CMIP6/PMIP4 models[J]. Climate of the Past, 2020, 16(5): 1777-1805.
DOI URL |
| [1] | 梁文翔, 骆震, 陈伏龙, 王统霞, 安杰, 龙爱华, 何朝飞. 基于CMIP6多模式集合的内陆河径流模拟及预估[J]. 地学前缘, 2024, 31(6): 450-461. |
| [2] | 王鹏寿, 许民, 韩海东, 李振中, 宋轩宇, 周卫永. 天山南坡阿克苏流域冰川物质平衡及其融水径流对气候变化的响应研究[J]. 地学前缘, 2024, 31(2): 435-446. |
| [3] | 李曙光, 汪洋, 刘盛遨. 大地幔楔的两个深部碳循环圈:差异及宜居效应[J]. 地学前缘, 2024, 31(1): 15-27. |
| [4] | 刘丛强, 李思亮, 刘学炎, 王宝利, 郎赟超, 丁虎, 郝丽萍, 张琼予. 人类世生物地球化学循环及其科学[J]. 地学前缘, 2024, 31(1): 455-466. |
| [5] | 张城钢, 魏静, 张玉涛, 王苒, 侯召硕, 赵敬轩, 张欣然. 官厅、密云水库上游流域土壤Sr、Mg、Ca对相关气候要素的指示意义[J]. 地学前缘, 2023, 30(6): 485-492. |
| [6] | 周波涛, 蔡怡亨, 韩振宇. 中国区域性暴雨事件未来变化:RegCM4动力降尺度集合预估[J]. 地学前缘, 2022, 29(5): 410-419. |
| [7] | 燕青. 亚洲高山区全新世中期气候及其影响下的冰川模拟[J]. 地学前缘, 2022, 29(5): 372-381. |
| [8] | 孙炜毅, 刘健, 严蜜, 宁亮. 全新世亚洲季风百年-千年尺度变化的模拟研究进展[J]. 地学前缘, 2022, 29(5): 342-354. |
| [9] | 张旭, 张炜晨, 王振乾, 郑凯, 邓凤飞. 季节性海冰驱动的冰期北大西洋“电容器”效应[J]. 地学前缘, 2022, 29(5): 334-341. |
| [10] | 谭宁, 张仲石, 郭正堂, 王会军. 上新世热带海道变化影响东亚气候的模拟研究[J]. 地学前缘, 2022, 29(5): 310-321. |
| [11] | 孙辉, 刘晓东. 青藏高原隆升气候效应的数值模拟研究进展概述[J]. 地学前缘, 2022, 29(5): 300-309. |
| [12] | 刘永岗, 张铭, 林琪凡, 刘鹏, 胡永云. 古气候中的沙尘变化及其气候影响[J]. 地学前缘, 2022, 29(5): 285-299. |
| [13] | 贾永刚, 阮文凤, 胡乃利, 乔玥, 李正辉, 胡聪. 现代暖期气候变暖对南海北部陆坡天然气水合物分解潜在影响[J]. 地学前缘, 2022, 29(4): 191-201. |
| [14] | 张洋, 徐继尚, 李广雪, 刘勇. 西太平洋暖池冰期旋回中的类ENSO式演化及其驱动机制[J]. 地学前缘, 2022, 29(4): 168-178. |
| [15] | 吴家望, 姚胜男, Amalia FILIPPIDI, 刘志飞, Gert J. DE LANGE. 全新世东地中海的陆源碎屑输入及其水文气候变化:海盆尺度地球化学分析[J]. 地学前缘, 2022, 29(4): 156-167. |
| 阅读次数 | ||||||
|
全文 |
|
|||||
|
摘要 |
|
|||||