Earth Science Frontiers ›› 2023, Vol. 30 ›› Issue (2): 514-525.DOI: 10.13745/j.esf.sf.2022.2.77
Previous Articles Next Articles
JIANG Xingchao1,2( ), XU Jing1,*(), LI Ruyi1, JIA Yifan1, YANG Pan1, LUO Jie1,2
Received:2022-02-10
Revised:2022-04-04
Online:2023-03-25
Published:2023-01-05
Contact:
XU Jing
CLC Number:
JIANG Xingchao, XU Jing, LI Ruyi, JIA Yifan, YANG Pan, LUO Jie. Soil chromium in Shantou City, Guangdong Province: Spatial distribution characteristics, source apportionment and influencing factors[J]. Earth Science Frontiers, 2023, 30(2): 514-525.

Fig.1 Deep (triangle) and shallow (dot) soil sampling sites in the study area
| 污染程度 | 富集因子 | 污染程度 | 富集因子 | 污染程度 | 富集因子 |
|---|---|---|---|---|---|
| Ⅰ 未污染 | <1 | Ⅲ中度污染 | 2~<5 | Ⅴ强烈污染 | 20~40 |
| Ⅱ轻微污染 | 1~<2 | Ⅳ显著污染 | 5~<20 | Ⅵ极强污染 | >40 |
Table 1 Grading standards of soil pollution according to the enrichment factor method
| 污染程度 | 富集因子 | 污染程度 | 富集因子 | 污染程度 | 富集因子 |
|---|---|---|---|---|---|
| Ⅰ 未污染 | <1 | Ⅲ中度污染 | 2~<5 | Ⅴ强烈污染 | 20~40 |
| Ⅱ轻微污染 | 1~<2 | Ⅳ显著污染 | 5~<20 | Ⅵ极强污染 | >40 |
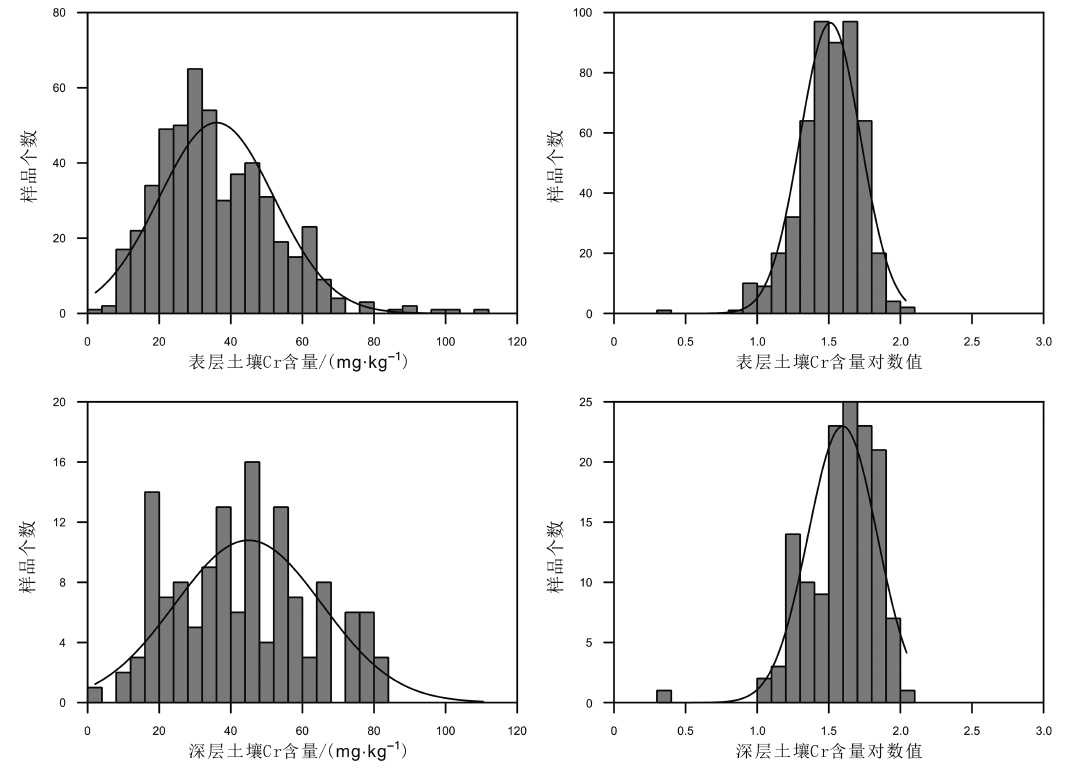
Fig.2 Frequency distribution of Cr in surface (upper panel) and deep soil samples
| 类型 | 最小值/ (mg·kg-1) | 中值/ (mg·kg-1) | 最大值/ (mg·kg-1) | 几何均值/ (mg·kg-1) | 标准差/ (mg·kg-1) | 变异系数/ % | 背景值/ (mg·kg-1) | 偏度 | 峰度 | |
|---|---|---|---|---|---|---|---|---|---|---|
| Cr元素 | 浅层 | 2.20 | 33.20 | 109.10 | 32.40 | 16.08 | 0.45 | 35.33 | 0.86 | 1.41 |
| 深层 | 2.10 | 44.20 | 110.50 | 39.52 | 20.55 | 0.46 | 44.44 | 0.39 | -0.32 | |
| SiO2 | 浅层 | 50.91 | 66.65 | 95.64 | 67.03 | 7.87 | 0.12 | 67.05 | 0.88 | 1.14 |
| 深层 | 52.46 | 64.28 | 93.76 | 65.57 | 8.36 | 0.13 | 65.68 | 1.02 | 0.82 | |
| Ti元素 | 浅层 | 581.20 | 3 367.80 | 6 847.80 | 3 091.51 | 1 085.09 | 0.33 | 3 292.69 | -0.07 | -0.5 |
| 深层 | 489.10 | 3 914.00 | 6 511.40 | 3 553.05 | 1 168.44 | 0.31 | 3 787.59 | -0.44 | -0.26 | |
Table 2 Statistical description of Cr, SiO2 and Ti soil contents in the study area
| 类型 | 最小值/ (mg·kg-1) | 中值/ (mg·kg-1) | 最大值/ (mg·kg-1) | 几何均值/ (mg·kg-1) | 标准差/ (mg·kg-1) | 变异系数/ % | 背景值/ (mg·kg-1) | 偏度 | 峰度 | |
|---|---|---|---|---|---|---|---|---|---|---|
| Cr元素 | 浅层 | 2.20 | 33.20 | 109.10 | 32.40 | 16.08 | 0.45 | 35.33 | 0.86 | 1.41 |
| 深层 | 2.10 | 44.20 | 110.50 | 39.52 | 20.55 | 0.46 | 44.44 | 0.39 | -0.32 | |
| SiO2 | 浅层 | 50.91 | 66.65 | 95.64 | 67.03 | 7.87 | 0.12 | 67.05 | 0.88 | 1.14 |
| 深层 | 52.46 | 64.28 | 93.76 | 65.57 | 8.36 | 0.13 | 65.68 | 1.02 | 0.82 | |
| Ti元素 | 浅层 | 581.20 | 3 367.80 | 6 847.80 | 3 091.51 | 1 085.09 | 0.33 | 3 292.69 | -0.07 | -0.5 |
| 深层 | 489.10 | 3 914.00 | 6 511.40 | 3 553.05 | 1 168.44 | 0.31 | 3 787.59 | -0.44 | -0.26 | |
| 元素及化合物 | Cr | SiO2 | Ti |
|---|---|---|---|
| Cr | 1 | -0.322* | 0.635** |
| SiO2 | 1 | -0.670** | |
| Ti | 1 |
Table 3 Pearson correlation matrix between the evaluation target and potential reference elements
| 元素及化合物 | Cr | SiO2 | Ti |
|---|---|---|---|
| Cr | 1 | -0.322* | 0.635** |
| SiO2 | 1 | -0.670** | |
| Ti | 1 |
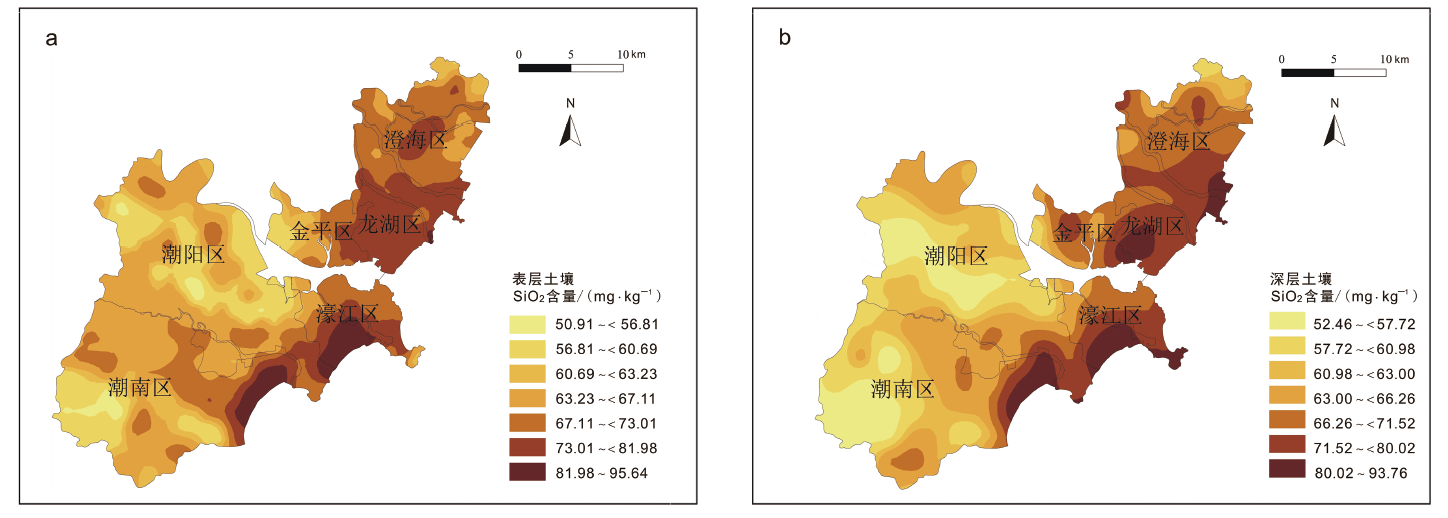
Fig.3 Spatial distribution of SiO2 contents in (a) surface and (b) deep soils of the study area
| 评价方法 | 污染等级 | Cr元素等级比重/% |
|---|---|---|
| 富集因子法 | I 未污染 | 66.34 |
| II 轻微污染 | 33.66 | |
| III 中度污染 | 0 | |
| IV 显著污染 | 0 | |
| V强烈污染 | 0 | |
| VI极强污染 | 0 |
Table 4 Evaluation results of Cr pollution in surface soil of Shantou City
| 评价方法 | 污染等级 | Cr元素等级比重/% |
|---|---|---|
| 富集因子法 | I 未污染 | 66.34 |
| II 轻微污染 | 33.66 | |
| III 中度污染 | 0 | |
| IV 显著污染 | 0 | |
| V强烈污染 | 0 | |
| VI极强污染 | 0 |
| 元素及 化合物 | 因子载荷 | |||
|---|---|---|---|---|
| PC1 | PC2 | PC3 | PC4 | |
| Fe2O3 | 0.957 | 0.054 | 0.137 | -0.130 |
| V | 0.952 | 0.040 | -0.098 | 0.093 |
| Ti | 0.932 | 0.025 | -0.060 | 0.052 |
| Sc | 0.932 | 0.017 | 0.026 | -0.075 |
| Co | 0.867 | 0.119 | 0.109 | -0.217 |
| SiO2 | -0.781 | -0.041 | -0.515 | 0.089 |
| MgO | 0.738 | -0.034 | -0.029 | 0.473 |
| Cr | 0.656 | 0.060 | -0.255 | 0.434 |
| Al2O3 | 0.645 | 0.037 | 0.629 | -0.246 |
| Be | 0.619 | 0.008 | 0.360 | 0.438 |
| Bi | -0.010 | 0.954 | 0.037 | -0.093 |
| As | 0.009 | 0.951 | 0.015 | -0.077 |
| Pb | 0.066 | 0.900 | 0.150 | 0.029 |
| Ag | 0.044 | 0.834 | -0.060 | 0.173 |
| Sb | 0.121 | 0.411 | -0.174 | 0.393 |
| K2O | -0.171 | -0.037 | 0.799 | 0.125 |
| Mn | 0.393 | 0.123 | 0.646 | -0.134 |
| CaO | -0.055 | -0.019 | -0.025 | 0.702 |
| Na2O | -0.170 | -0.064 | 0.504 | 0.643 |
| Cd | 0.034 | 0.271 | -0.038 | 0.350 |
| 特征值 | 7.224 | 3.547 | 2.096 | 1.947 |
| 解释率 | 36.120 | 17.734 | 10.478 | 9.735 |
Table 5 Factor loadings of soil elements
| 元素及 化合物 | 因子载荷 | |||
|---|---|---|---|---|
| PC1 | PC2 | PC3 | PC4 | |
| Fe2O3 | 0.957 | 0.054 | 0.137 | -0.130 |
| V | 0.952 | 0.040 | -0.098 | 0.093 |
| Ti | 0.932 | 0.025 | -0.060 | 0.052 |
| Sc | 0.932 | 0.017 | 0.026 | -0.075 |
| Co | 0.867 | 0.119 | 0.109 | -0.217 |
| SiO2 | -0.781 | -0.041 | -0.515 | 0.089 |
| MgO | 0.738 | -0.034 | -0.029 | 0.473 |
| Cr | 0.656 | 0.060 | -0.255 | 0.434 |
| Al2O3 | 0.645 | 0.037 | 0.629 | -0.246 |
| Be | 0.619 | 0.008 | 0.360 | 0.438 |
| Bi | -0.010 | 0.954 | 0.037 | -0.093 |
| As | 0.009 | 0.951 | 0.015 | -0.077 |
| Pb | 0.066 | 0.900 | 0.150 | 0.029 |
| Ag | 0.044 | 0.834 | -0.060 | 0.173 |
| Sb | 0.121 | 0.411 | -0.174 | 0.393 |
| K2O | -0.171 | -0.037 | 0.799 | 0.125 |
| Mn | 0.393 | 0.123 | 0.646 | -0.134 |
| CaO | -0.055 | -0.019 | -0.025 | 0.702 |
| Na2O | -0.170 | -0.064 | 0.504 | 0.643 |
| Cd | 0.034 | 0.271 | -0.038 | 0.350 |
| 特征值 | 7.224 | 3.547 | 2.096 | 1.947 |
| 解释率 | 36.120 | 17.734 | 10.478 | 9.735 |
| 元素及化合物 | As | Cr | Pb | Fe2O3 | Ag | Bi | Co | Sc | Ti | V |
|---|---|---|---|---|---|---|---|---|---|---|
| As | 1 | 0.035 | 0.855** | 0.076 | 0.700** | 0.986** | 0.142** | 0.030 | 0.024 | 0.054 |
| Cr | 1 | 0.107* | 0.512** | 0.143** | 0.036 | 0.445** | 0.541** | 0.635** | 0.681** | |
| Pb | 1 | 0.103* | 0.639** | 0.849** | 0.158** | 0.086 | 0.081 | 0.106* | ||
| Fe2O3 | 1 | 0.071 | 0.055 | 0.872** | 0.883** | 0.870** | 0.872** | |||
| Ag | 1 | 0.712** | 0.079 | 0.039 | 0.087 | 0.087* | ||||
| Bi | 1 | 0.115** | 0.010 | 0.008 | 0.032 | |||||
| Co | 1 | 0.814** | 0.743** | 0.777** | ||||||
| Sc | 1 | 0.877** | 0.891** | |||||||
| Ti | 1 | 0.927** | ||||||||
| V | 1 |
Table 6 Pearson correlation coefficients between element pairs
| 元素及化合物 | As | Cr | Pb | Fe2O3 | Ag | Bi | Co | Sc | Ti | V |
|---|---|---|---|---|---|---|---|---|---|---|
| As | 1 | 0.035 | 0.855** | 0.076 | 0.700** | 0.986** | 0.142** | 0.030 | 0.024 | 0.054 |
| Cr | 1 | 0.107* | 0.512** | 0.143** | 0.036 | 0.445** | 0.541** | 0.635** | 0.681** | |
| Pb | 1 | 0.103* | 0.639** | 0.849** | 0.158** | 0.086 | 0.081 | 0.106* | ||
| Fe2O3 | 1 | 0.071 | 0.055 | 0.872** | 0.883** | 0.870** | 0.872** | |||
| Ag | 1 | 0.712** | 0.079 | 0.039 | 0.087 | 0.087* | ||||
| Bi | 1 | 0.115** | 0.010 | 0.008 | 0.032 | |||||
| Co | 1 | 0.814** | 0.743** | 0.777** | ||||||
| Sc | 1 | 0.877** | 0.891** | |||||||
| Ti | 1 | 0.927** | ||||||||
| V | 1 |
| 主成分 | 比例/% |
|---|---|
| PC1 | 20.24% |
| PC2 | 1.96% |
| PC3 | 3.18% |
| PC4 | 19.46% |
| 未知来源 | 55.17% |
| 合计 | 100.00% |
Table 7 Contribution rates of different principal components
| 主成分 | 比例/% |
|---|---|
| PC1 | 20.24% |
| PC2 | 1.96% |
| PC3 | 3.18% |
| PC4 | 19.46% |
| 未知来源 | 55.17% |
| 合计 | 100.00% |
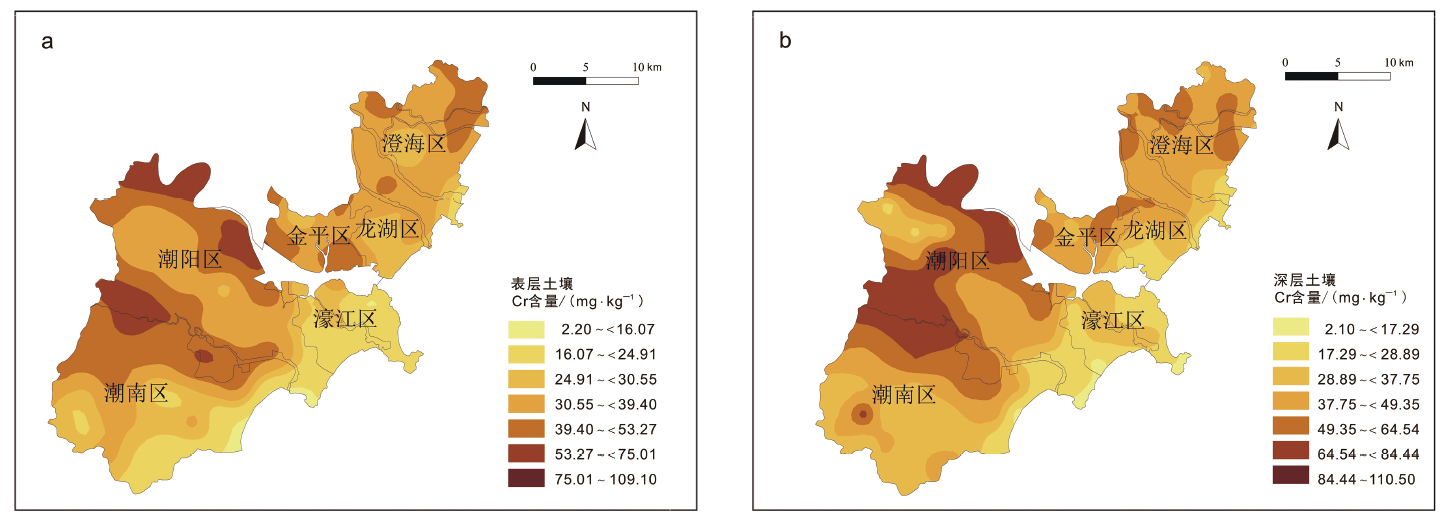
Fig.4 Spatial distributions of Cr contents in (a) surface and (b) deep soils of the study area
| 类型 | 样本数 | 表层土壤Cr含量/(mg·kg-1) | |
|---|---|---|---|
| 均值 | 变幅 | ||
| 赤红壤 | 140 | 29.88a | 7.70~76.60 |
| 滨海砂土 | 13 | 25.20b | 2.20~66.90 |
| 水稻土 | 358 | 38.85a | 8.20~109.10 |
| 建筑用地 | 136 | 35.87a | 2.20~109.10 |
| 农用地 | 359 | 36.16a | 7.70~99.80 |
| 未利用地 | 16 | 34.96a | 14.70~63.40 |
| 白垩纪花岗岩 | 90 | 28.16d | 8.20~99.80 |
| 第四纪沉积物 | 341 | 39.62b | 2.20~109.10 |
| 三叠纪砂岩 | 1 | 48.50a | 48.50~48.50 |
| 侏罗纪花岗岩 | 71 | 29.42d | 7.70~68.70 |
| 侏罗纪碎屑岩 | 5 | 37.66c | 23.20~68.40 |
Table 8 Cr soil contents under different soil types, parent materials and land uses
| 类型 | 样本数 | 表层土壤Cr含量/(mg·kg-1) | |
|---|---|---|---|
| 均值 | 变幅 | ||
| 赤红壤 | 140 | 29.88a | 7.70~76.60 |
| 滨海砂土 | 13 | 25.20b | 2.20~66.90 |
| 水稻土 | 358 | 38.85a | 8.20~109.10 |
| 建筑用地 | 136 | 35.87a | 2.20~109.10 |
| 农用地 | 359 | 36.16a | 7.70~99.80 |
| 未利用地 | 16 | 34.96a | 14.70~63.40 |
| 白垩纪花岗岩 | 90 | 28.16d | 8.20~99.80 |
| 第四纪沉积物 | 341 | 39.62b | 2.20~109.10 |
| 三叠纪砂岩 | 1 | 48.50a | 48.50~48.50 |
| 侏罗纪花岗岩 | 71 | 29.42d | 7.70~68.70 |
| 侏罗纪碎屑岩 | 5 | 37.66c | 23.20~68.40 |
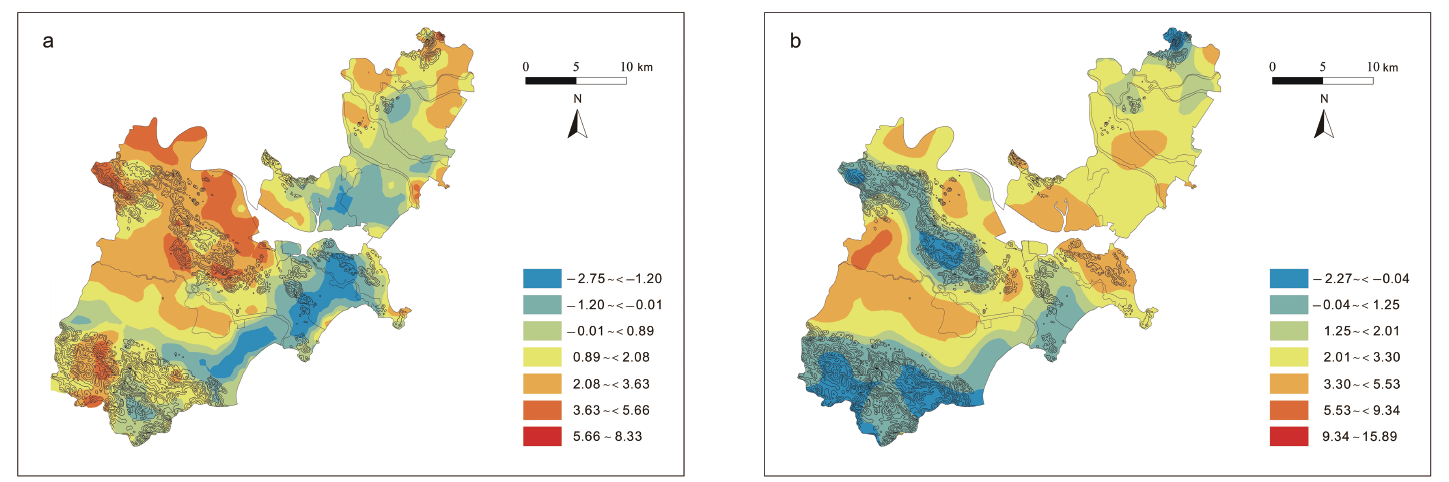
Fig.5 Spatial distribution of (a) PC1 and (b) PC4 in the study area
| [1] | 赵慧, 何博, 王铁宇, 等. 我国南方典型城市土壤重金属污染特征及源汇关系分析[J]. 环境科学学报, 2019, 39(7): 2231-2239. |
| [2] | 张飙为, 刘旺, 何巍, 等. 全自动消解仪测定土壤重金属前处理方法优化[J]. 三峡生态环境监测, 2021, 6(4): 32-38. |
| [3] | 李东艳, FRANCOIS M, 任玉芬, 等. 重金属污染土壤萃取方法选择及参数优化[J]. 地学前缘, 2005, 12(增刊1): 189-192. |
| [4] | 杨晓燕, 侯青叶, 杨忠芳. 重金属元素Cd在水稻土剖面中的分配系数及其影响因素研究: 以四川省成都平原区为例[J]. 地学前缘, 2013, 20(2): 246-256. |
| [5] |
陈世宝, 王萌, 李杉杉, 等. 中国农田土壤重金属污染防治现状与问题思考[J]. 地学前缘, 2019, 26(6): 35-41.
DOI |
| [6] | 陈思宏. 铬化学形态分析与植物Cr(Ⅵ)吸收主要途径解析[D]. 南京: 南京农业大学, 2019. |
| [7] |
NICHOLSON F A, SMITH S R, ALLOWAY B J, et al. An inventory of heavy metals inputs to agricultural soils in England and Wales[J]. Science of the Total Environment, 2003, 311(1/2/3): 205-219.
DOI URL |
| [8] | 李勇, 周永章, 张澄博, 等. 基于局部Moran’s I和GIS的珠江三角洲肝癌高发区蔬菜土壤中Ni、 Cr的空间热点分析[J]. 环境科学, 2010, 31(6): 1617-1623. |
| [9] |
BRAHUSHI F, DÖRFLER U, SCHROLL R, et al. Stimulation of reductive dechlorination of hexachlorobenzene in soil by inducing the native microbial activity[J]. Chemosphere, 2004, 55(11): 1477-1484.
PMID |
| [10] |
POHL H R, MCCLURE P R, FAY M, et al. Public health assessment of hexachlorobenzene[J]. Chemosphere, 2001, 43: 903-908.
PMID |
| [11] | 陈慧茹, 董亚玲, 王琦, 等. 重金属污染土壤中Cd、 Cr、 Pb元素向水稻的迁移累积研究[J]. 中国农学通报, 2015, 31(12): 236-241. |
| [12] |
FACCHINELLI A, SACCHI E, MALLEN L. Multivariate statistical and GIS-based approach to identify heavy metal sources in soils[J]. Environmental Pollution, 2001, 114(3): 313-324.
DOI PMID |
| [13] | 宁登豪, 邓洪平, 李文巧, 等. 三峡库区城镇消落区土壤重金属污染特征分析[J]. 三峡生态环境监测, 2021, 6(4): 11-23. |
| [14] | 余涛, 杨忠芳, 钟坚, 等. 土壤中重金属元素Pb、 Cd地球化学行为影响因素研究[J]. 地学前缘, 2008, 15(5): 67-73. |
| [15] |
LINDSTRÖM M. Urban land use influences on heavy metal fluxes and surface sediment concentrations of small lakes[J]. Water, Air, and Soil Pollution, 2001, 126(3): 363-383.
DOI URL |
| [16] | 张慧, 马鑫鹏, 史晓磊, 等. 区域土壤Cd和Cr空间分布的影响因素研究[J]. 土壤, 2018, 50(5): 989-998. |
| [17] | 刘玉娟, 陈俊. 淮南市矿区土壤Pb元素含量的空间分布特征[J]. 有色金属设计, 2019, 46(1): 109-113. |
| [18] | 袁峰, 白晓宇, 周涛发, 等. 元素空间分布插值方法的对比研究: 以铜陵地区土壤中的重金属元素为例[J]. 地学前缘, 2008, 15(5): 103-109. |
| [19] | 李勇, 周永章, 窦磊, 等. 基于多元统计和傅立叶和谱分析的土壤重金属的来源解析及其风险评价[J]. 地学前缘, 2010, 17(4): 253-261. |
| [20] | 韦彬, 侯青叶, 唐志敏, 等. 珠江水系沉积物重金属元素背景值估算及污染特征分析[J]. 现代地质, 2019, 33(2): 293-304. |
| [21] | 匡荟芬, 胡春华, 吴根林, 等. 结合主成分分析法(PCA)和正定矩阵因子分解法(PMF)的鄱阳湖丰水期表层沉积物重金属源解析[J]. 湖泊科学, 2020, 32(4): 964-976. |
| [22] | 乔雯, 王议, 张德强, 等. 某矿区土壤重金属分布特征及来源解析[J]. 现代地质, 2022, 36(2): 543-551. |
| [23] |
张素荣, 王昌宇, 刘继红, 等. 雄安新区西南部土壤重金属污染特征及生态风险评价[J]. 地学前缘, 2021, 28(4): 238-249.
DOI |
| [24] | 黄伟, 张钘, 罗晓佼, 等. 三峡库区高阳平湖水体富营养化主要驱动因子研究: 基于主成分分析法[J]. 三峡生态环境监测, 2022, 7(1): 1-7. |
| [25] |
HENRY R C. Multivariate receptor modeling by N-dimensional edge detection[J]. Chemometrics and Intelligent Laboratory Systems, 2003, 65(2): 179-189.
DOI URL |
| [26] |
RIZZO M J, SCHEFF P A. Assessing ozone networks using positive matrix factorization[J]. Environmental Progress, 2004, 23(2): 110-119.
DOI URL |
| [27] |
CHUEINTA W, HOPKE P K, PAATERO P. Investigation of sources of atmospheric aerosol at urban and suburban residential areas in Thailand by positive matrix factorization[J]. Atmospheric Environment, 2000, 34(20): 3319-3329.
DOI URL |
| [28] |
HENRY R C. History and fundamentals of multivariate air quality receptor models[J]. Chemometrics and Intelligent Laboratory Systems, 1997, 37(1): 37-42.
DOI URL |
| [29] | THURSTON G D, SPENGLER J D. A quantitative assessment of source contributions to inhalable particulate matter pollution in metropolitan Boston[J]. Atmospheric Environment, 1985, 19(1): 9-25. |
| [30] | 臧传子, 温汉辉, 蔡立梅, 等. 广东省揭阳市土壤铅的空间分布特征及影响因素[J]. 现代地质, 2021, 35(5): 1425-1432. |
| [31] | 田瑜. 粉末压片制样X射线荧光光谱法测定土壤中的几种重金属[J]. 安阳工学院学报, 2018, 17(6): 24-27. |
| [32] | 李娟娟, 马金涛, 楚秀娟, 等. 应用地积累指数法和富集因子法对铜矿区土壤重金属污染的安全评价[J]. 中国安全科学学报, 2006, 16(12): 135-139, 170. |
| [33] | 潘纯珍. 重庆主城区交通环境颗粒物污染特征研究[D]. 重庆: 西南农业大学, 2005. |
| [34] |
SHAHEEN M E, TAWFIK W, MANKOULA A F, et al. Determination of heavy metal content and pollution indices in the agricultural soils using laser ablation inductively coupled plasma mass spectrometry[J]. Environmental Science and Pollution Research International, 2021, 28(27): 36039-36052.
DOI PMID |
| [35] | 汪洋, 吴缨, 张良璞, 等. 合肥市初夏PM2.5中重金属元素污染特征分析[J]. 安徽化工, 2016, 42(1): 74-76. |
| [36] | 范晓婷, 蒋艳雪, 崔斌, 等. 富集因子法中参比元素的选取方法: 以元江底泥中重金属污染评价为例[J]. 环境科学学报, 2016, 36(10): 3795-3803. |
| [37] |
SUTHERLAND R A. Bed sediment-associated trace metals in an urban stream, Oahu, Hawaii[J]. Environmental Geology, 2000, 39(6): 611-627.
DOI URL |
| [38] |
JIANG Y X, CHAO S H, LIU J W, et al. Source apportionment and health risk assessment of heavy metals in soil for a township in Jiangsu Province, China[J]. Chemosphere, 2017, 168: 1658-1668.
DOI PMID |
| [39] | 吕建树, 何华春. 江苏海岸带土壤重金属来源解析及空间分布[J]. 环境科学, 2018, 39(6): 2853-2864. |
| [40] |
ZHANG S W, SHEN C Y, CHEN X Y, et al. Spatial interpolation of soil texture using compositional kriging and regression kriging with consideration of the characteristics of compositional data and environment variables[J]. Journal of Integrative Agriculture, 2013, 12(9): 1673-1683.
DOI URL |
| [41] | 雷志栋, 杨诗秀, 许志荣, 等. 土壤特性空间变异性初步研究[J]. 水利学报, 1985, 19(9): 10-21. |
| [42] |
SAHOO P K, DALL’AGNOL R, SALOMÃO G N, et al. Regional-scale mapping for determining geochemical background values in soils of the Itacaiúnas River Basin, Brazil: the use of compositional data analysis (CoDA)[J]. Geoderma, 2020, 376: 114504.
DOI URL |
| [43] |
熊廷浩, 黄益国, 周旋, 等. 湖南省油菜主产区土壤养分含量与重金属污染风险评价[J]. 浙江农业学报, 2021, 33(10): 1904-1912.
DOI |
| [44] | 陈秋平, 胥思勤, 安艳玲, 等. 锑矿区土壤中As、 Sb和Bi的污染与植物累积特征[J]. 贵州农业科学, 2014, 42(9): 236-240. |
| [45] | TURNBULL R, ROGERS K, MARTIN A, et al. Human impacts recorded in chemical and isotopic fingerprints of soils from Dunedin City, New Zealand[J]. Science ofthe Total Environment, 2019, 673: 455-469. |
| [46] | 温鹏翀, 温汉辉, 蔡立梅, 等. 典型产业承接区土壤砷含量的空间分布特征及影响因素[J]. 环境化学, 2021, 40(1): 204-212. |
| [47] | 陈秋平, 胥思勤, 安艳玲, 等. 锑矿土壤中As和Sb的分布、 形态及生物可利用性[J]. 环境化学, 2014, 33(8): 1301-1306. |
| [48] |
SIMS D B, HUDSON A C, KELLER J E, et al. Trace elements migrating from tailings to rock varnish laminated sediments in an old mining region from Nelson, Nevada, USA[J]. International Journal of Sediment Research, 2022, 37(2): 202-213.
DOI URL |
| [49] | 许继影, 桂和荣, 葛春贵, 等. 淮北青东煤矿深层地热水的水文地球化学特征与水源识别[J]. 工程地质学报, 2021, 29(4): 1037-1047. |
| [50] | 张慧, 郑志志, 杨欢, 等. 基于多元统计和地统计的肇源县表层土壤重金属来源辨析[J]. 土壤, 2017, 49(4): 819-827. |
| [51] | 周云娟, 冯芙蓉, 林秋丽. 快速城市化地区土壤Cr含量空间分布特征及潜在污染评价[J]. 安徽农学通报, 2021, 27(8): 116-117, 148. |
| [52] | 王涵植, 温汉辉, 蔡立梅, 等. 广东省揭阳市土壤铬的空间结构及分布特征研究[J]. 土壤, 2020, 52(5): 941-947. |
| [53] | 王高飞. 土壤中重金属元素形态分析方法及形态分布的影响因素[J]. 当代化工研究, 2019(6): 13-14. |
| [54] | 赵其国. 水稻土的类型特征及其管理[J]. 土壤, 1992, 24(4): 169-175. |
| [55] | 周琴, 姜军, 徐仁扣. Cu(Ⅱ)、 Pb( Ⅱ)和Cd(Ⅱ)在红壤胶体和非胶体颗粒上吸附的比较[J]. 土壤学报, 2018, 55(1): 131-138. |
| [56] | 冯连君, 储雪蕾, 张启锐, 等. 化学蚀变指数(CIA)及其在新元古代碎屑岩中的应用[J]. 地学前缘, 2003, 10(4): 539-544. |
| [57] | 吴文斌, 杨鹏, 唐华俊, 等. 土地利用对土壤性质影响的区域差异研究[J]. 中国农业科学, 2007, 40(8): 1697-1702. |
| [1] | YANG Hui, FAN Huaiwei, XU Xiao, ZHANG Yunhui, WANG Wenfeng, YAN Zhaojin, WANG Cheng, WANG Junhui, LIU Lei, WANG Ran, CI Hui. Analysis of spatio-temporal variations and influencing factors of atmospheric CO2 concentrations in energy resources development areas [J]. Earth Science Frontiers, 2024, 31(4): 147-164. |
| [2] | WANG Hanyu, ZHOU Yongzhang, XU Yating, WANG Weixi, CAO Wei, LIU Yongqiang, HE Juxiang, LU Kefei. IoT monitoring and visualization of urban soil pollution based on microservice architecture [J]. Earth Science Frontiers, 2024, 31(4): 165-182. |
| [3] | YAN Liping, XIE Xianming, TANG Zhenhua. Study on soil heavy metal environmental capacity in Shantou City based on source analysis [J]. Earth Science Frontiers, 2024, 31(4): 403-416. |
| [4] | HE Jiahui, MAO Hairu, XUE Yang, LIAO Fu, GAO Bai, RAO Zhi, YANG Yang, LIU Yuanyuan, WANG Guangcai. Variability in spatiotemporal groundwater nitrate concentrations in the northeast Ganfu Plain [J]. Earth Science Frontiers, 2024, 31(3): 360-370. |
| [5] | LIU Hai, WEI Wei, SONG Yang, PAN Yang, LI Yingchun. Pollution characteristics, potential ecological risks and sources of heavy metal pollution in lake sediments in Huoqiu County [J]. Earth Science Frontiers, 2024, 31(3): 420-431. |
| [6] | MA Junjie, CHENG Jie, LIU Xiaohong, SUN Hongyan. Research on paths to realize the values of ecological products in national parks based on the geological and nature environmental settings of the China National Parks [J]. Earth Science Frontiers, 2024, 31(3): 458-469. |
| [7] | LI Shanshan, ZHANG Rong, FEI Yang, LIANG Jiahui, YANG Bing, WANG Meng, SHI Huading, CHEN Shibao. How iron influence heavy metal migration and transformation in paddy soils—a review [J]. Earth Science Frontiers, 2024, 31(2): 103-110. |
| [8] | ZHU Fujie, QU Longze, LI Ping, WEI Wenxia, LI Peizhong, WANG Lifu, LI Benhang, WANG Jiao, REN Gengbo, WU Zhineng, MA Xiaodong. Odor measurement methods and prediction models: A review [J]. Earth Science Frontiers, 2024, 31(2): 13-19. |
| [9] | WANG Meng, YU Lei, QIN Luyao, SUN Xiaoyi, WANG Jing, LIU Jiaxiao, CHEN Shibao. Scientific issues and research methods of soil environmental standards: A case study on cadmium [J]. Earth Science Frontiers, 2024, 31(2): 147-156. |
| [10] | ZHENG Jiarui, LENG Wenpeng, WANG Jiajia, ZHI Liqin, WANG Shuo, LI Jiabin, GUO Peng, WEI Wenxia, SONG Yun. Bioremediation technologies for cleaning up chlorinated-hydrocarbon contaminated sites—a review [J]. Earth Science Frontiers, 2024, 31(2): 157-172. |
| [11] | GUO Xuehui, HUANG Renliang, WAN Jianhua. Heavy metal pollution in agricultural land around a tailings pond, northern Hubei and ecological and human health risk assessment [J]. Earth Science Frontiers, 2024, 31(2): 77-92. |
| [12] | DONG Xin, HU Haoran, ZHANG Xiaoqing, REN Dajun, ZHANG Shuqin. A Meta-analysis of the distribution characteristics and ecological risk of heavy metals in mining areas [J]. Earth Science Frontiers, 2024, 31(2): 93-102. |
| [13] | WEI Hongbin, LUO Ming, ZHANG Shiwen, ZHOU Pengfei. Effects of different remediation treatments on heavy metals and microorganisms in mining wasteland [J]. Earth Science Frontiers, 2023, 30(5): 541-552. |
| [14] | ZHANG Guanglu, LIU Haiyan, GUO Huaming, SUN Zhanxue, WANG Zhen, WU Tonghang. Occurrences and health risks of high-nitrate groundwater in typical piedmont areas of the North China Plain [J]. Earth Science Frontiers, 2023, 30(4): 485-503. |
| [15] | CHI Minghui, QIN Yanwen, YANG Chenchen, WEN Quan, SUN Ning, ZHU Huailin, ZHANG Lei. Distribution and evaluation of nitrogen, phosphorus and organic matter in sediments of the middle reaches of the Chaobai River [J]. Earth Science Frontiers, 2022, 29(4): 448-454. |
| Viewed | ||||||
|
Full text |
|
|||||
|
Abstract |
|
|||||