Earth Science Frontiers ›› 2021, Vol. 28 ›› Issue (4): 219-228.DOI: 10.13745/j.esf.sf.2020.10.10
Previous Articles Next Articles
LIU Yanhui1,2( ), YANG Xiaoyu1,3, BAO Nisha1,3,*(), GU Xiaowei1,3
Received:2020-09-29
Revised:2020-11-22
Online:2021-07-25
Published:2021-07-25
Contact:
BAO Nisha
CLC Number:
LIU Yanhui, YANG Xiaoyu, BAO Nisha, GU Xiaowei. Estimating biomass of reclaimed vegetation in prairie mining area: Inversion method based on Worldview-3 and Sentinel-1 SAR data[J]. Earth Science Frontiers, 2021, 28(4): 219-228.
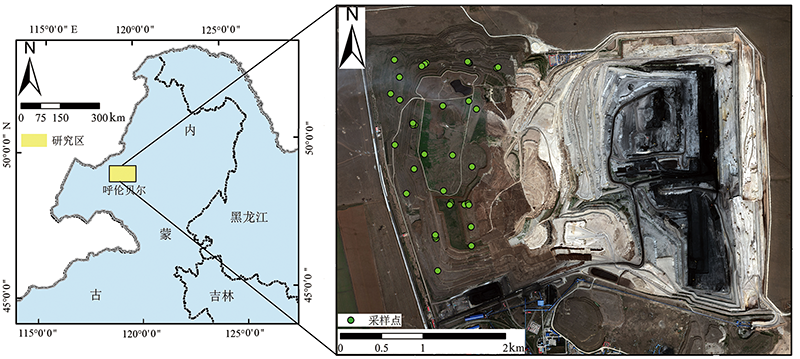
Fig.1 Locations of the research area and sampling sites

Fig.2 Types of reclaimed vegetation
| 传感器 | 分辨率 | 波段名称/极化方式 | 波长 |
|---|---|---|---|
| 海岸波段 | 400~450 nm | ||
| 蓝波段 | 450~510 nm | ||
| 绿波段 | 510~580 nm | ||
| Worldview-3 | 1.24 m | 黄波段 | 585~625 nm |
| 红波段 | 630~690 nm | ||
| 红边波段 | 705~745 nm | ||
| 近红外1 | 770~895 nm | ||
| 近红外2 | 860~1 040 nm | ||
| Sentinel-1 | 5 m×20 m | VH和VV极化 | 7.5~3.75 cm |
Table 1 Remote sensing data parameters
| 传感器 | 分辨率 | 波段名称/极化方式 | 波长 |
|---|---|---|---|
| 海岸波段 | 400~450 nm | ||
| 蓝波段 | 450~510 nm | ||
| 绿波段 | 510~580 nm | ||
| Worldview-3 | 1.24 m | 黄波段 | 585~625 nm |
| 红波段 | 630~690 nm | ||
| 红边波段 | 705~745 nm | ||
| 近红外1 | 770~895 nm | ||
| 近红外2 | 860~1 040 nm | ||
| Sentinel-1 | 5 m×20 m | VH和VV极化 | 7.5~3.75 cm |
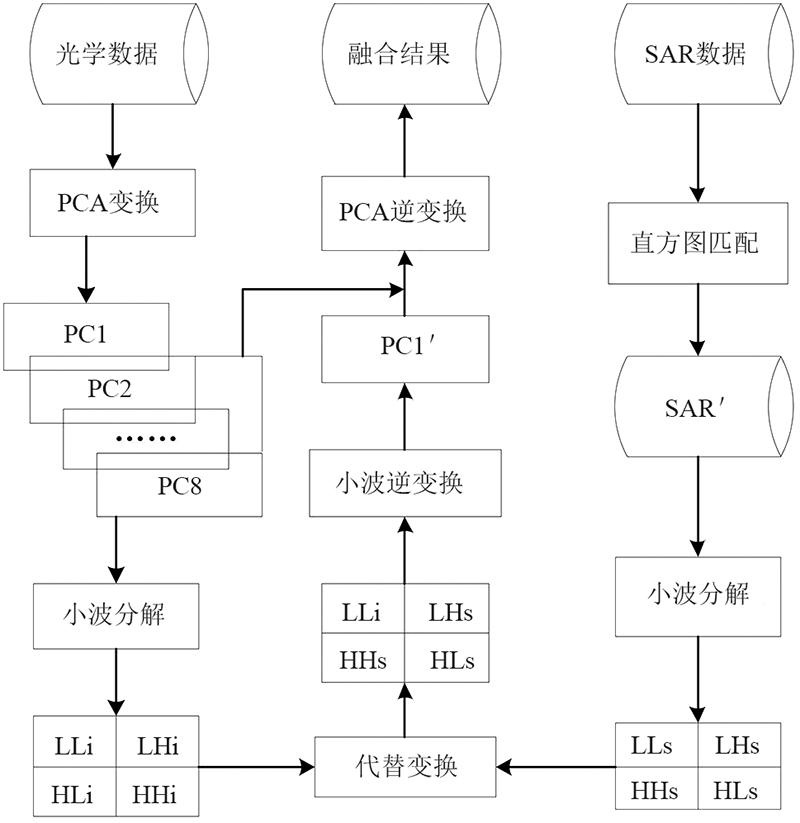
Fig.3 Image fusion flow chart
| 植被指数 | 计算公式 | 优点 |
|---|---|---|
| NDVI | | NDVI指数是目前遥感影像植被分类研究应用最广泛的植被指数,是植被长势及覆盖度的最佳指标 |
| DVI | NIR1-R | DVI指数对土壤背景变化敏感,适用植被发育早中期或植被覆盖度较低的区域 |
| RVI | | RVI指数对茂盛、覆盖度较高的植被敏感,绿色植被RVI值较高,非植被RVI值较低 |
| NDGI | | NDGI指数在NDVI指数的基础上将红波段换成了绿波段,可用来对不同活力植被形式进行检验 |
| ARVI | | ARVI指数根据蓝波段与红波段对大气响应的差异,用红蓝波段组合替代NDVI指数中的红光波段,以减少大气对植被指数的影响 |
| EVI | | EVI指数不仅能克服大气对光谱反射的衰减,还能削弱土壤背景的影响 |
| | | |
Table 2 Calculation formulas and their advantages for 7 vegetable indexes
| 植被指数 | 计算公式 | 优点 |
|---|---|---|
| NDVI | | NDVI指数是目前遥感影像植被分类研究应用最广泛的植被指数,是植被长势及覆盖度的最佳指标 |
| DVI | NIR1-R | DVI指数对土壤背景变化敏感,适用植被发育早中期或植被覆盖度较低的区域 |
| RVI | | RVI指数对茂盛、覆盖度较高的植被敏感,绿色植被RVI值较高,非植被RVI值较低 |
| NDGI | | NDGI指数在NDVI指数的基础上将红波段换成了绿波段,可用来对不同活力植被形式进行检验 |
| ARVI | | ARVI指数根据蓝波段与红波段对大气响应的差异,用红蓝波段组合替代NDVI指数中的红光波段,以减少大气对植被指数的影响 |
| EVI | | EVI指数不仅能克服大气对光谱反射的衰减,还能削弱土壤背景的影响 |
| | | |

Fig.4 Comparison of fusion results
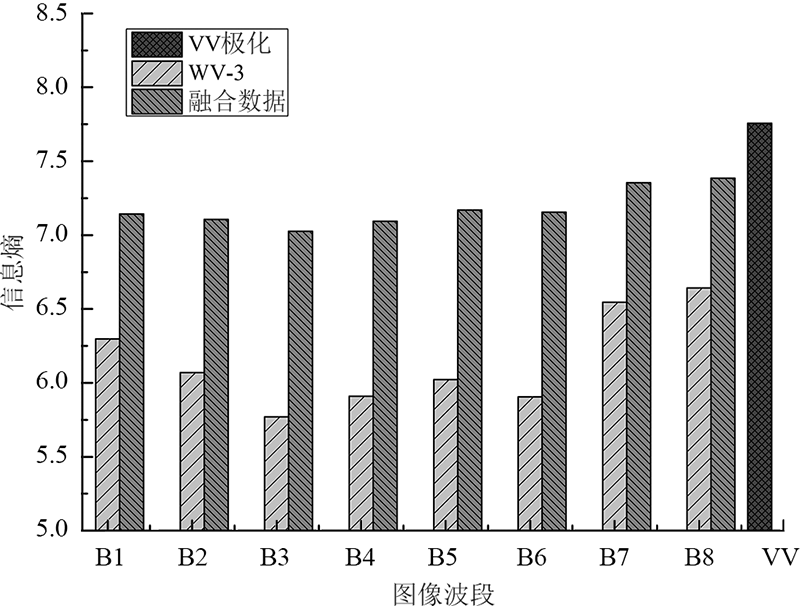
Fig.5 Information entropy values for all available bands of WV-3 before and after image fusion and for Sentinel-1 VV-polarized SAR image
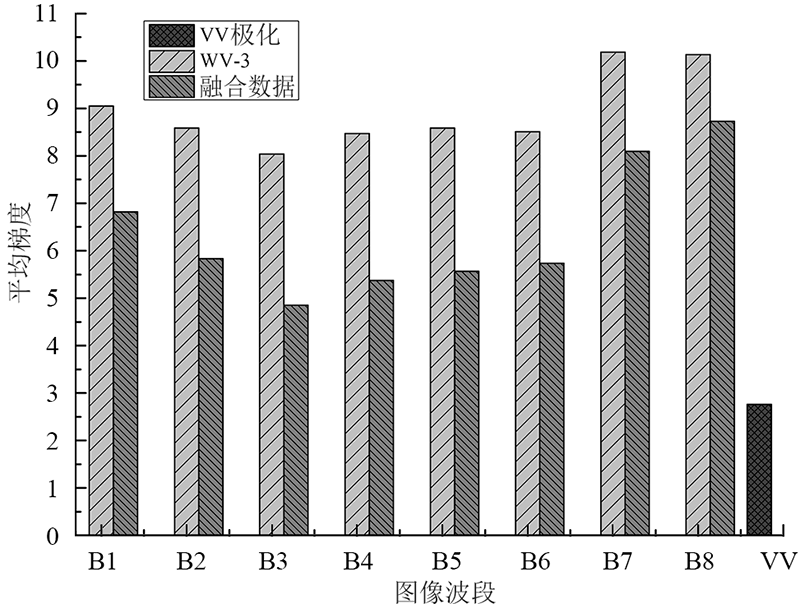
Fig.6 Average gradient values for all available bands of WV-3 before and after image fusion and for sentinel-1 VV-polarized SAR image

Fig.7 Similarity coefficient and spectral distortion between WV-3 image and fused image for all spectral bands
| Worldview-3 | Sentinel-1 | 融合 | |||||||||||||||||
|---|---|---|---|---|---|---|---|---|---|---|---|---|---|---|---|---|---|---|---|
| 波段反射率 | 纹理特征 | 极化/纹理特征 | 融合波段 | ||||||||||||||||
| 变量 | 相关性 | 变量 | 相关性 | 变量 | 相关性 | 变量 | 相关性 | ||||||||||||
| 海岸波段 | -0.323 | 波段4均值 | -0.741** | VH | 0.504** | 波段1 (RHB1) | -0.759** | ||||||||||||
| 蓝波段 | -0.474* | 波段5均值 | -0.792** | VV | 0.410* | 波段2 (RHB2) | -0.806** | ||||||||||||
| 绿波段 | -0.372 | 波段5相关性 | -0.358* | VV均值 | 0.412** | 波段3(RHB3) | -0.837** | ||||||||||||
| 黄波段 | -0.620** | 波段6均值 | 0.511** | VV方差 | 0.174 | 波段4 (RHB4) | -0.834** | ||||||||||||
| 红波段 | -0.657** | 波段6相关性 | -0.412* | VV均一性 | -0.238 | 波段5 (RHB5) | -0.800** | ||||||||||||
| 红边波段 | 0.215 | 波段7均值 | 0.760** | VV对比度 | 0.165 | 波段6 (RHB6) | 0.564** | ||||||||||||
| 近红外1(NIR1) | 0.694** | 波段7方差 | 0.700** | VV相异性 | 0.201 | 波段7 (RHB7) | 0.842** | ||||||||||||
| 近红外2(NIR2) | 0.718** | 波段7均一性 | -0.593** | VV信息熵 | 0.257 | 波段8 (RHB8) | 0.874** | ||||||||||||
| RVI | 0.790** | 波段7相异性 | 0.535* | VV二阶矩 | -0.219 | ||||||||||||||
| NGVI | 0.871** | 波段7信息熵 | 0.510** | VV相关性 | 0.169 | ||||||||||||||
| NDVI705 | 0.835** | 波段7二阶矩 | -0.366* | VH均值 | 0.505** | ||||||||||||||
| NDVI | 0.874** | 波段8均值 | 0.748** | VH方差 | -0.061 | ||||||||||||||
| EVI | 0.876** | 波段8方差 | 0.669** | VH均一性 | 0.069 | ||||||||||||||
| DVI | 0.833** | 波段8均一性 | -0.600** | VH对比度 | 0.064 | ||||||||||||||
| ARVI | 0.845** | 波段8相异性 | 0.558** | VH相异性 | -0.016 | ||||||||||||||
| 波段8信息熵 | 0.612** | VH信息熵 | -0.133 | ||||||||||||||||
| 波段8二阶矩 | 0.520** | VH二阶矩 | 0.298 | ||||||||||||||||
| VH相关性 | -0.195 | ||||||||||||||||||
Table 3 Correlation analysis between biomass and different variables
| Worldview-3 | Sentinel-1 | 融合 | |||||||||||||||||
|---|---|---|---|---|---|---|---|---|---|---|---|---|---|---|---|---|---|---|---|
| 波段反射率 | 纹理特征 | 极化/纹理特征 | 融合波段 | ||||||||||||||||
| 变量 | 相关性 | 变量 | 相关性 | 变量 | 相关性 | 变量 | 相关性 | ||||||||||||
| 海岸波段 | -0.323 | 波段4均值 | -0.741** | VH | 0.504** | 波段1 (RHB1) | -0.759** | ||||||||||||
| 蓝波段 | -0.474* | 波段5均值 | -0.792** | VV | 0.410* | 波段2 (RHB2) | -0.806** | ||||||||||||
| 绿波段 | -0.372 | 波段5相关性 | -0.358* | VV均值 | 0.412** | 波段3(RHB3) | -0.837** | ||||||||||||
| 黄波段 | -0.620** | 波段6均值 | 0.511** | VV方差 | 0.174 | 波段4 (RHB4) | -0.834** | ||||||||||||
| 红波段 | -0.657** | 波段6相关性 | -0.412* | VV均一性 | -0.238 | 波段5 (RHB5) | -0.800** | ||||||||||||
| 红边波段 | 0.215 | 波段7均值 | 0.760** | VV对比度 | 0.165 | 波段6 (RHB6) | 0.564** | ||||||||||||
| 近红外1(NIR1) | 0.694** | 波段7方差 | 0.700** | VV相异性 | 0.201 | 波段7 (RHB7) | 0.842** | ||||||||||||
| 近红外2(NIR2) | 0.718** | 波段7均一性 | -0.593** | VV信息熵 | 0.257 | 波段8 (RHB8) | 0.874** | ||||||||||||
| RVI | 0.790** | 波段7相异性 | 0.535* | VV二阶矩 | -0.219 | ||||||||||||||
| NGVI | 0.871** | 波段7信息熵 | 0.510** | VV相关性 | 0.169 | ||||||||||||||
| NDVI705 | 0.835** | 波段7二阶矩 | -0.366* | VH均值 | 0.505** | ||||||||||||||
| NDVI | 0.874** | 波段8均值 | 0.748** | VH方差 | -0.061 | ||||||||||||||
| EVI | 0.876** | 波段8方差 | 0.669** | VH均一性 | 0.069 | ||||||||||||||
| DVI | 0.833** | 波段8均一性 | -0.600** | VH对比度 | 0.064 | ||||||||||||||
| ARVI | 0.845** | 波段8相异性 | 0.558** | VH相异性 | -0.016 | ||||||||||||||
| 波段8信息熵 | 0.612** | VH信息熵 | -0.133 | ||||||||||||||||
| 波段8二阶矩 | 0.520** | VH二阶矩 | 0.298 | ||||||||||||||||
| VH相关性 | -0.195 | ||||||||||||||||||
| 变量 | 模型 | 建模精度 (n=21) | 验证精度 (n=11) | |||||||
|---|---|---|---|---|---|---|---|---|---|---|
| R2 | RMSE/ (g·m-2) | Ac/% | R2 | RMSE/ (g·m-2) | Ac/% | |||||
| EVI | | 0.816 3 | 17.318 7 | 80.56 | 0.709 8 | 24.201 8 | 73.12 | |||
| VH | | 0.430 6 | 30.488 8 | 65.78 | 0.324 | 42.110 4 | 53.22 | |||
| NDVI,VHME | | 0.834 0 | 16.464 6 | 81.52 | 0.696 3 | 23.680 1 | 73.69 | |||
| RHB8 | | 0.784 2 | 18.767 9 | 78.94 | 0.798 3 | 22.828 3 | 74.64 | |||
Table 4 Optimal model and its accuracy for each data set
| 变量 | 模型 | 建模精度 (n=21) | 验证精度 (n=11) | |||||||
|---|---|---|---|---|---|---|---|---|---|---|
| R2 | RMSE/ (g·m-2) | Ac/% | R2 | RMSE/ (g·m-2) | Ac/% | |||||
| EVI | | 0.816 3 | 17.318 7 | 80.56 | 0.709 8 | 24.201 8 | 73.12 | |||
| VH | | 0.430 6 | 30.488 8 | 65.78 | 0.324 | 42.110 4 | 53.22 | |||
| NDVI,VHME | | 0.834 0 | 16.464 6 | 81.52 | 0.696 3 | 23.680 1 | 73.69 | |||
| RHB8 | | 0.784 2 | 18.767 9 | 78.94 | 0.798 3 | 22.828 3 | 74.64 | |||
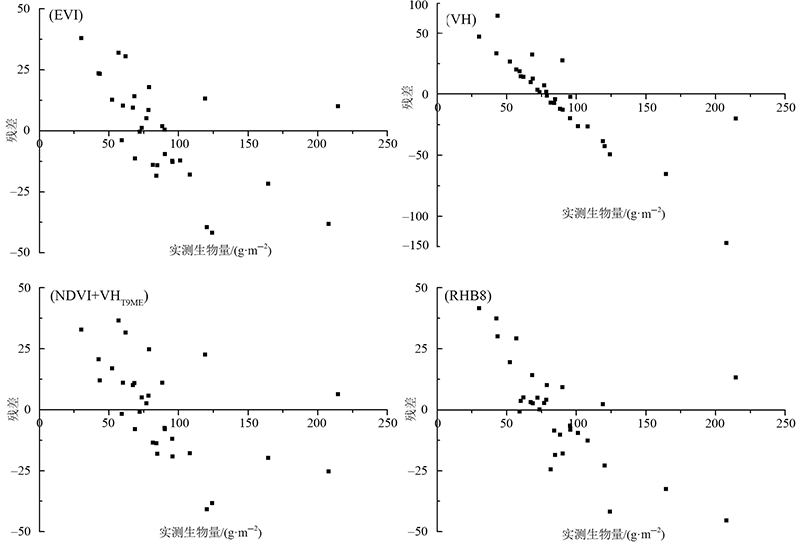
Fig.8 Residual plots for models
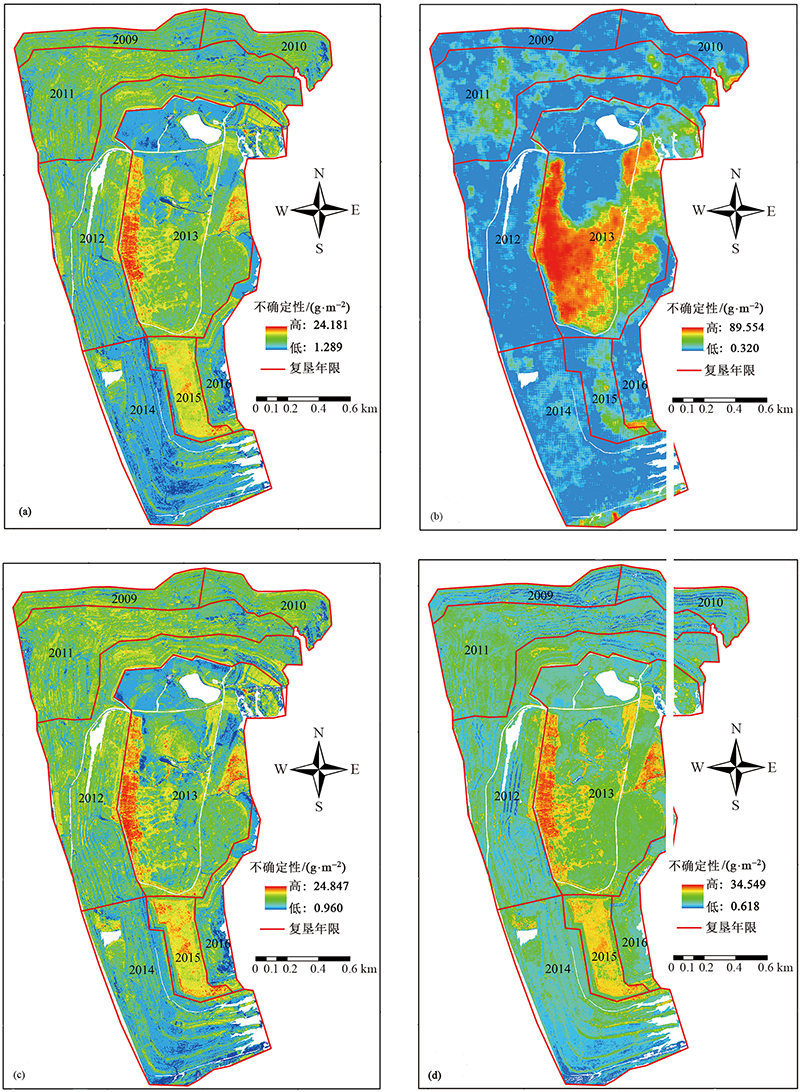
Fig.9 Distribution of estimation uncertainties for different biomass surface concentrations. (a) 60-100 g/m2; (b) 40-60 g/m2; (c) <40 g/m2; (d) >100 g/m2.
| [1] | 杨勤学, 赵冰清, 郭东罡. 中国北方露天煤矿区植被恢复研究进展[J]. 生态学杂志, 2015, 34(4):1152-1157. |
| [2] | 张泽民, 吕昌河, 谢苗苗, 等. 基于WorldView 2影像的矿区植被重建效果评估[J]. 生态学报, 2018, 38(4):1301-1310. |
| [3] | 张兆彤, 王金满, 张佳瑞. 矿区复垦土壤与植被交互影响的研究进展[J]. 土壤, 2018, 50(2):239-247. |
| [4] | PETROPOULOS G P, PARTSINEVELOS P, MITRAKA Z. Change detection of surface mining activity and reclamation based on a machine learning approach of multi-temporal Landsat TM imagery[J]. Geocarto International, 2013, 28(4):323-342. |
| [5] | 张耀, 周伟. 安太堡露天矿区复垦地植被覆盖度反演估算研究[J]. 中南林业科技大学学报, 2016, 36(11):113-119. |
| [6] | 曾纳, 任小丽, 何洪林, 等. 基于神经网络的三江源区草地地上生物量估算[J]. 环境科学研究, 2017, 30(1):59-66. |
| [7] | 安海波, 李斐, 赵萌莉, 等. 基于优化光谱指数的牧草生物量估算[J]. 光谱学与光谱分析, 2015, 35(11):3155. |
| [8] | 赖炽敏, 赖日文, 薛娴, 等. 基于植被盖度和高度的不同退化程度高寒草地地上生物量估算[J]. 中国沙漠, 2019, 39(5):127-134. |
| [9] | 阮兰君, 杨燕琼. 东莞市针叶类森林生物量遥感模型研究[J]. 林业与环境科学, 2018, 34(1):32-36. |
| [10] | WANG G Q, LIU S M, LIU T X, et al. Modelling above-ground biomass based on vegetation indexes: a modified approach for biomass estimation in semi-arid grasslands[J]. International Journal of Remote Sensing, 2019, 40(10):3835-3854. |
| [11] | 乔正年, 耿庆宏, 徐雁南. 运用卫星遥感数据对杨树人工林生物量的估算[J]. 东北林业大学学报, 2019, 47(5):66-71. |
| [12] |
CHANG J G, SHOSHANY M, OH Y. Polarimetric radar vegetation index for biomass estimation in desert fringe ecosystems[J]. IEEE Transactions on Geoscience and Remote Sensing, 2018, 56(12):7102-7108.
DOI URL |
| [13] | 潘磊, 孙玉军. 应用Sentinel-1影像纹理信息模型估测杉木林生物量[J]. 东北林业大学学报, 2018, 46(1):58-62. |
| [14] |
HUANG C D, YE X Y, DENG C B, et al. Mapping above-ground biomass by integrating optical and SAR imagery: a case study of Xixi national wetland park, China[J]. Remote Sensing, 2016, 8(8):647.
DOI URL |
| [15] |
SHAO Z F, ZHANG L J, WANG L. Stacked sparse autoencoder modeling using the synergy of airborne LiDAR and satellite optical and SAR data to map forest above-ground biomass[J]. IEEE Journal of Selected Topics in Applied Earth Observations and Remote Sensing, 2017, 10(12):5569-5582.
DOI URL |
| [16] | 行敏锋, 何彬彬. 主被动遥感数据协同估算干旱区草原植被生物量[J]. 遥感技术与应用, 2015, 30(6):1122-1128. |
| [17] | 秦立厚, 张茂震, 钟世红, 等. 森林生物量估算中模型不确定性分析[J]. 生态学报, 2017, 37(23):7912-7919. |
| [18] | 郭山川, 汤傲, 李效顺, 等. 融合主被动遥感的乌海矿区土地损伤测度[J]. 生态与农村环境学报, 2018, 34(8):678-685. |
| [19] | 申艳琴. 半干旱区煤炭开采对植被扰动规律的研究: 以神东矿区为例[D]. 徐州: 中国矿业大学, 2014. |
| [20] | 李小静. 彬长煤矿地表沉陷区植被变化遥感监测研究[D]. 西安: 西安科技大学, 2013. |
| [21] |
LIU L Y, WANG J H, HUANG W J, et al. Estimating winter wheat plant water content using red edge parameters[J]. International Journal of Remote Sensing, 2004, 25(17):3331-3342.
DOI URL |
| [22] |
DONG T F, LIU J G, SHANG J L, et al. Assessment of red-edge vegetation indices for crop leaf area index estimation[J]. Remote Sensing of Environment, 2019, 222:133-143.
DOI URL |
| [23] | MAIMAITIJIANG M, GHULAM A, SIDIKE P, et al. Unmanned Aerial System (UAS): based phenotyping of soybean using multi-sensor data fusion and extreme learning machine[J]. ISPRS Journal of Photogrammetry and Remote Sensing, 2017, 134:43-58. |
| [24] |
BARATI S, RAYEGANI B, SAATI M, et al. Comparison the accuracies of different spectral indices for estimation of vegetation cover fraction in sparse vegetated areas[J]. The Egyptian Journal of Remote Sensing and Space Science, 2011, 14(1):49-56.
DOI URL |
| [25] |
ELMORE A J, MUSTARD J F, MANNING S J, et al. Quantifying vegetation change in semiarid environments: precision and accuracy of spectral mixture analysis and the normalized difference vegetation index[J]. Remote Sensing of Environment, 2000, 73(1):87-102.
DOI URL |
| [26] | LIU Y N, GONG W S, XING Y Q, et al. Estimation of the forest stand mean height and aboveground biomass in Northeast China using SAR Sentinel-1B, multispectral Sentinel-2A, and DEM imagery[J]. ISPRS Journal of Photogrammetry and Remote Sensing, 2019, 151:277-289. |
| [1] | YUAN Feng, LI Xiaohui, TIAN Weidong, ZHOU Guanqun, WANG Jinju, GE Can, GUO Xianzheng, ZHENG Chaojie. Key issues in three-dimensional predictive modeling of mineral prospectivity [J]. Earth Science Frontiers, 2024, 31(4): 119-128. |
| [2] | WANG Ziye, ZUO Renguang. Mapping Himalayan leucogranites by machine learning using multi-source data [J]. Earth Science Frontiers, 2023, 30(5): 216-226. |
| [3] | WANG Ying, DING Xiaozhong, HAN Kunying, CHEN Jian, LIU Jingwen, LU Tianqi, WANG Juntao, SHI Chenglong, JIN Ming, PANG Jianfeng. Geological characteristics and evolution of the Schrödinger basin and adjacent areas: Insights from multi-source remote sensing data [J]. Earth Science Frontiers, 2023, 30(4): 525-538. |
| Viewed | ||||||
|
Full text |
|
|||||
|
Abstract |
|
|||||