地学前缘 ›› 2021, Vol. 28 ›› Issue (5): 230-259.DOI: 10.13745/j.esf.sf.2021.9.38
所属专题: 印度-欧亚大陆碰撞及其远程效应
• “印度-欧亚大陆碰撞及其远程效应”专栏 • 上一篇 下一篇
赵俊猛1,2,*( ), 张培震3, 张先康4, Xiaohui YUAN5, Rainer KIND5, Robertvander HILST6, 甘卫军7, 孙继敏8, 邓涛9, 刘红兵1, 裴顺平1,2, 徐强1, 张衡1, 嘉世旭4, 颜茂都1,2, 郭晓玉3, 卢占武10, 杨小平7, 邓攻1, 琚长辉1
收稿日期:2021-09-05
修回日期:2021-09-20
出版日期:2021-09-25
发布日期:2021-10-29
通信作者:
赵俊猛
作者简介:赵俊猛(1957—),男,研究员,博士生导师,主要从事青藏高原壳幔结构与地球动力学研究。E-mail: zhaojm@itpcas.ac.cn
基金资助:
ZHAO Junmeng1,2,*(), ZHANG Peizhen3, ZHANG Xiankang4, Xiaohui YUAN5, Rainer KIND5, Robert van der HILST6, GAN Weijun7, SUN Jimin8, DENG Tao9, LIU Hongbing1, PEI Shunping1,2, XU Qiang1, ZHANG Heng1, JIA Shixu4, YAN Maodu1,2, GUO Xiaoyu3, LU Zhanwu10, YANG Xiaoping7, DENG Gong1, JU Changhui1
Received:2021-09-05
Revised:2021-09-20
Online:2021-09-25
Published:2021-10-29
Contact:
ZHAO Junmeng
摘要:
为系统、深入地研究中国西部盆(盆地)、山(山脉)、原(高原)的壳幔结构与深部动力学过程,2003年我们提出并领导实施了“羚羊计划”(ANTILOPE-Array Network of Tibetan International Lithospheric Observation and Probe Experiments),在青藏高原先后完成了羚羊-I(ANTILOPE-I)到羚羊-IV(ANTILOPE-IV)4条二维宽频带台阵剖面,而在青藏高原东西构造结则实施了羚羊-V和羚羊-VI两个三维宽频带台阵探测。另外,我们将前期在准噶尔盆地、天山造山带、塔里木盆地、阿尔金造山带和柴达木盆地开展的九条综合地球物理观测剖面也纳入羚羊计划的总体框架中来。
通过“羚羊计划”的实施,我们在中国西部(包括西北部的环青藏高原盆山体系以及西南部的青藏高原)取得了大量的、高质量的、综合的第一手观测数据,获得了中国西部盆、山、原精细的壳幔结构,系统地揭示了中国西部盆山原的深部地球动力学过程。主要结论总结如下:确定了准噶尔盆地基底的结构与属性,优化了盆地的基底构造格架;建立了天山造山带“层间插入削减”新的陆内造山模式,揭示了印欧碰撞在天山岩石圈缩短44%的去向以及由洋-陆俯冲到陆-陆碰撞俯冲的转换机制;揭示了塔里木盆地、阿尔金造山带和柴达木盆地的盆山接触关系;获得了塔里木盆地顺时针旋转的深部几何学、运动学和动力学证据;确定了青藏高原之下印度板块与欧亚板块的碰撞边界;发现目前的青藏高原由南部的印度板块、北部的欧亚板块和夹持于二者之间的巨型破碎区——西藏“板块”构成,首次确定了各自的岩石圈底边界;修正了高原变形的两个端员模型;建立了深部构造对地表地形的制约关系;系统地揭示了印度板块沿喜马拉雅造山带俯冲的水平距离与俯冲角度的变化规律与控制因素。
“羚羊计划”以其巨大的观测网络与综合地球物理探测技术,采用地球物理学、地质学、地球化学等不同学科相结合的分析方法,揭示了印度板块俯冲、西藏巨型破碎区发育、塔里木板块顺时针旋转、西部水汽通道提前关闭、中国西北部干旱、沙漠化提前这一深部结构、动力学过程及其对地表地形、油气资源和环境变化的制约关系,推动了青藏高原地球系统科学理论的发展。
中图分类号:
赵俊猛, 张培震, 张先康, Xiaohui YUAN, Rainer KIND, Robertvander HILST, 甘卫军, 孙继敏, 邓涛, 刘红兵, 裴顺平, 徐强, 张衡, 嘉世旭, 颜茂都, 郭晓玉, 卢占武, 杨小平, 邓攻, 琚长辉. 中国西部壳幔结构与动力学过程及其对资源环境的制约:“羚羊计划”研究进展[J]. 地学前缘, 2021, 28(5): 230-259.
ZHAO Junmeng, ZHANG Peizhen, ZHANG Xiankang, Xiaohui YUAN, Rainer KIND, Robert van der HILST, GAN Weijun, SUN Jimin, DENG Tao, LIU Hongbing, PEI Shunping, XU Qiang, ZHANG Heng, JIA Shixu, YAN Maodu, GUO Xiaoyu, LU Zhanwu, YANG Xiaoping, DENG Gong, JU Changhui. Crust-mantle structure and geodynamic processes in western China and their constraints on resources and environment: Research progress of the ANTILOPE Project[J]. Earth Science Frontiers, 2021, 28(5): 230-259.
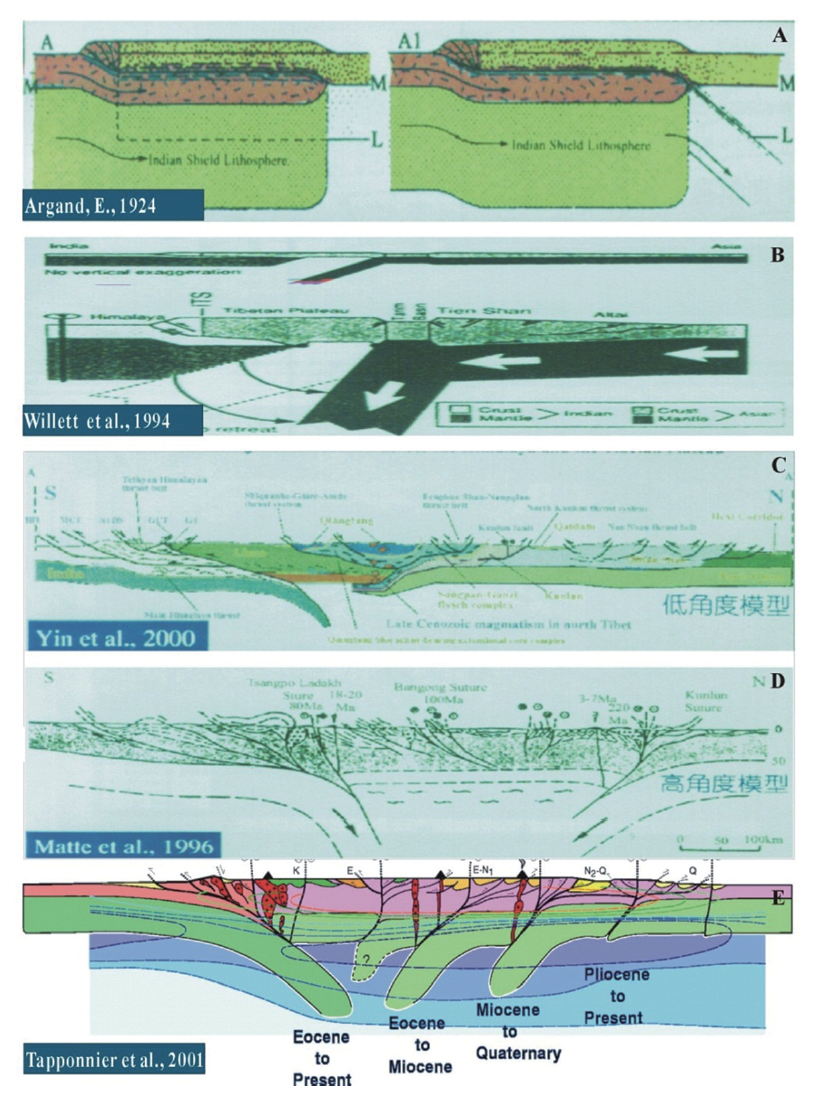
图1 关于青藏高原隆升的部分地球动力学模型(据文献[2,3,4,5,6])
Fig.1 Selected geodynamic models describing the uplift of the Tibetan Plateau. Modified after [2-6].
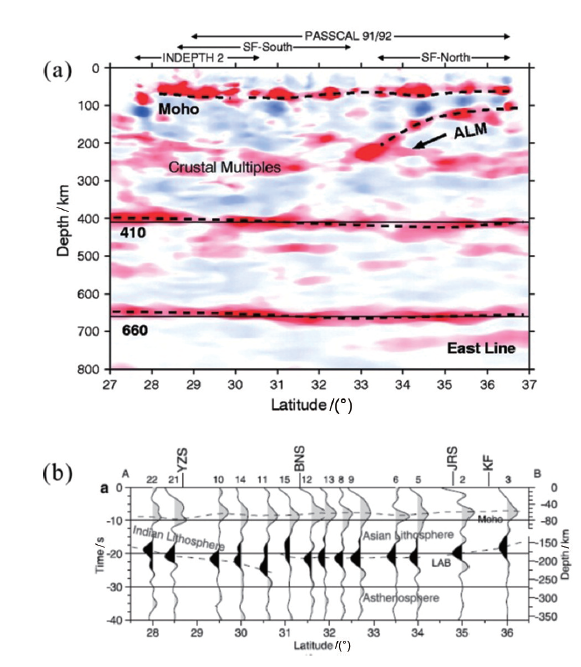
图2 Kind(2002)、Kumar(2006)等研究结果之间的比较(据文献[8,9]) (a)Kind(2002)的结果认为,亚洲岩石圈地幔由北向南俯冲到青藏高原之下,没有发现印度岩石圈地幔由南向北俯冲;(b)Kumar等(2006)的结果,发现印度岩石圈由南向北俯冲到青藏高原之下。
Fig.2 Comparison of research results by Kind et al. (2002) vs. Kumar et al. (2006) (adapted from [8-9]). (a) Kind et al. (2002) suggest a N-W subduction of the Asian lithospheric mantle beneath the Tibetan Plateau, finding no S-N subduction of the Indian lithospheric mantle. (b) Kumar et al. (2006) show a S-N subduction of the Indian lithosphere beneath the Tibetan Plateau.

图3 “羚羊计划(ANTILOPE)”及其进展
Fig.3 The ANTILOPE Project and its progress
| 名称 | 探测手段 | 长度/ km | 观测 点数 |
|---|---|---|---|
| 额敏—奇台剖面 | 人工地震宽角反射/折射探测 重磁联合反演 | 800 800 | 230 |
| I-I剖面 | 地震转换波法 重磁联合反演 | 400 400 | 400 |
| II-II剖面 | 地震转换波法 重磁联合反演 | 400 | 400 |
| III-III剖面 | 地震转换波法 重磁联合反演 | 400 | 400 |
| IV-IV剖面 | 地震转换波法 重磁联合反演 | 400 | 400 |
| 沙雅—布尔津剖面 | 人工地震宽角反射/折射 大地电磁探测 重力探测 | 1000 | 340 600 |
| 库尔勒—吉木萨尔 | 人工地震宽角反射/折射 重磁联合反演 | 900 | 300 |
| 拜城—大柴旦剖面 | 人工地震宽角反射/折射 重磁联合反演 | 1400 | 400 |
| 格尔木—花海子 | 人工地震宽角反射/折射 重磁联合反演 | 400 | 120 |
| ANTILOPE-I | 宽频带地震台阵 | 800 | 63 |
| ANTILOPE-II | 宽频带地震台阵 | 800 | 82 |
| ANTILOPE-III | 宽频带地震台阵 | 800 | 80 |
| ANTILOPE-IV | 宽频带地震台阵 | 800 | 80 |
| ANTILOPE-V | 宽频带地震台阵 宽频带大地电磁 | 台阵 500 | 90 17 |
| ANTILOPE-VI | 宽频带地震台阵 大地电磁 | 台阵 500 | 80 100 |
表1 羚羊计划所有剖面的工作量
Table 1 Descriptions of all profiles determined by the ANTILOPE Project
| 名称 | 探测手段 | 长度/ km | 观测 点数 |
|---|---|---|---|
| 额敏—奇台剖面 | 人工地震宽角反射/折射探测 重磁联合反演 | 800 800 | 230 |
| I-I剖面 | 地震转换波法 重磁联合反演 | 400 400 | 400 |
| II-II剖面 | 地震转换波法 重磁联合反演 | 400 | 400 |
| III-III剖面 | 地震转换波法 重磁联合反演 | 400 | 400 |
| IV-IV剖面 | 地震转换波法 重磁联合反演 | 400 | 400 |
| 沙雅—布尔津剖面 | 人工地震宽角反射/折射 大地电磁探测 重力探测 | 1000 | 340 600 |
| 库尔勒—吉木萨尔 | 人工地震宽角反射/折射 重磁联合反演 | 900 | 300 |
| 拜城—大柴旦剖面 | 人工地震宽角反射/折射 重磁联合反演 | 1400 | 400 |
| 格尔木—花海子 | 人工地震宽角反射/折射 重磁联合反演 | 400 | 120 |
| ANTILOPE-I | 宽频带地震台阵 | 800 | 63 |
| ANTILOPE-II | 宽频带地震台阵 | 800 | 82 |
| ANTILOPE-III | 宽频带地震台阵 | 800 | 80 |
| ANTILOPE-IV | 宽频带地震台阵 | 800 | 80 |
| ANTILOPE-V | 宽频带地震台阵 宽频带大地电磁 | 台阵 500 | 90 17 |
| ANTILOPE-VI | 宽频带地震台阵 大地电磁 | 台阵 500 | 80 100 |

图4 喜马拉雅西构造结地震台站分布
Fig.4 Distribution of seismic stations in the western Himalayan syntaxis
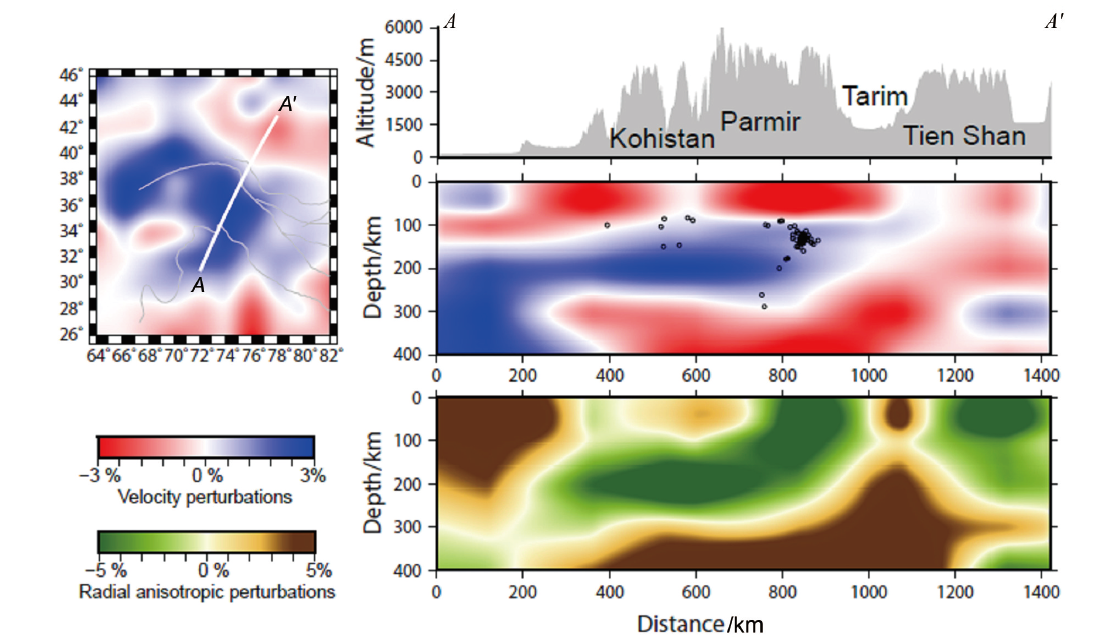
图5 帕米尔高原东部A-A’剖面的成像结果所揭示的西构造结东部的壳幔结构和径向各向异性参数特征 左上图显示了A-A’剖面的位置和200 km深度的速度扰动。
Fig.5 Characteristics of crust-mantle structure and radial anisotropy parameters revealed by the seismographic imaging of the A-A’ profile in the eastern Pamir Plateau. The top left panel shows the location of the A-A’ profile and the velocity perturbations at 200 km depth.

图6 帕米尔高原东部沿A-A’,B-B’和C-C’三条剖面的接收函数共转换点叠加图像(据文献[18]) 黑色的圆点表示剖面两侧50 km范围内的中深源地震分布,图6a中的绿色线表示Moho异常的位置。
Fig.6 (a) Simplified geological map of the study area and (b-d) common conversion point images of receiver functions along cross-sections A-A’, B-B’ and C-C’(adapted from [18]). The black circles are the projected intermediate-depth earthquakes perpendicular to the profile within 50 km. The green lines in Fig.6a highlight the anomalous locations of the Moho depth.
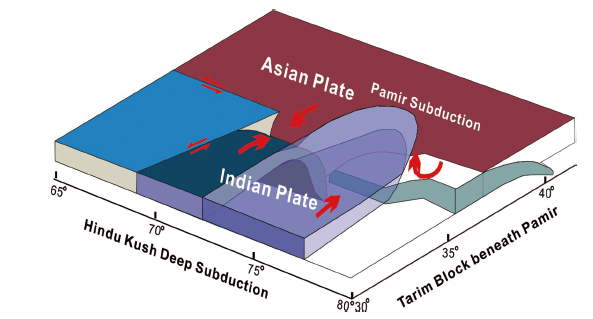
图7 喜马拉雅西构造结之下碰撞板块构造格局
Fig.7 Configurations of colliding plates below the West Himalayan syntaxis
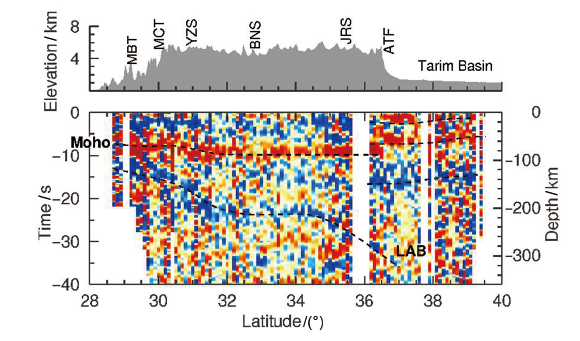
图8 ANTILOPE-I 剖面S波接收函数叠加图像(据文献[21]) 红色表示正的振幅,表明速度随深度发生跳跃式增加;蓝色表示负的振幅,表明速度随深度急剧减小。莫霍面和LAB以虚线标出。每条剖面的上方标有地形高程和沿剖面的主要缝合线和断裂的位置。MBT—主边界逆冲断层;MCT—主中央逆冲断层;YZS—雅鲁藏布缝合带;BNS—班公—怒江缝合带;JRS—金沙江缝合带;ATF—阿尔金断裂。
Fig.8 S receiver function (S-RF) along ANTILOPE-I profile (adapted after [21]). Red (blue) color represents the positive (negative) amplitudes, indicating the velocity jump increases (decreases) with depth; The Moho and LAB phases are marked by dashed lines. The elevation is plotted at the top panel, together with the position of the major sutures and faults. MBT, Main Boundary Thrust; MCT, Main Central Thrust; YZS, Yarlong-Zangbo Suture, BNS, Bangong-Nujiang Suture; JRS, Jinsha-River Suture; ATF, Altyn-Tagh Fault.

图9 ANTILOPE-I 剖面P波接收函数共转换点叠加图像(据文献[21]) 该图的上端为沿剖面的地形起伏;地形下面的蓝线和红线分别代表由S波接收函数所确定的印度板块和亚洲板块的位置。
Fig.9 P receiver function (P-RF) CCP image along ANTILOPE-I profile (adapted after [21]). Topographic feature is shown in the top panel. Blue and green bars below the top panel mark the positions of the Indian and Asian Plates, respectively, as determined by the S receiver functions.
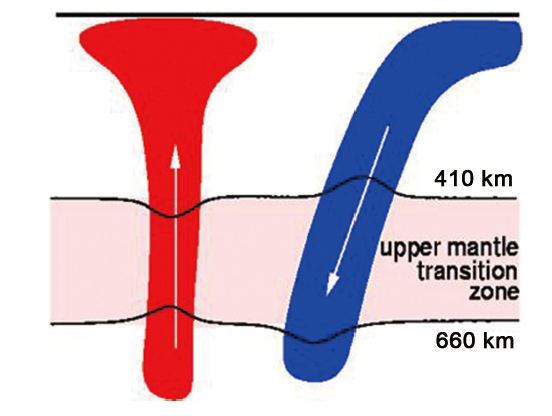
图10 地幔过渡带受到温度扰动时的行为方式
Fig.10 Behavior of the mantle transition zone when subjected to temperature perturbations
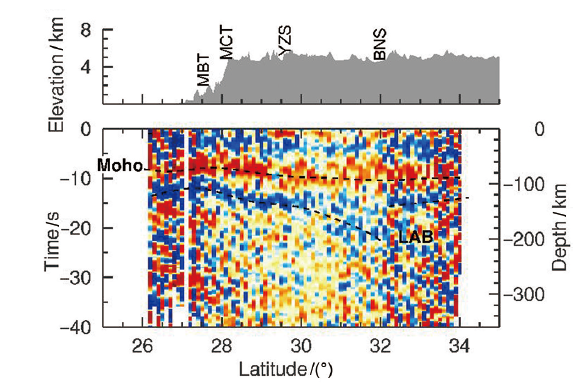
图11 ANTILOPE-II剖面S波接收函数叠加图像(据文献[21])
Fig.11 S receiver functions along ANTILOPE-II profile.Adapted from [21].

图12 ANTILOPE-II 剖面P波接收函数共转换点叠加图像(据文献[21]) 该图的上端为沿剖面的地形起伏;地形下面的蓝线和红线分别代表由S波接收函数所确定的印度板块和西藏板块的位置。
Fig.12 P-RF CCP image along ANTILOPE-II profile (adapted after [21]). Topography is depicted in the top panel. Blue and red bars below the top panel mark the positions of the Indian and Tibetan Plates, respectively, as determined by the S receiver functions.

图13 INDEPTH剖面的P波接收函数共转换点叠加图像(据文献[8-9,21]) 地形下方的蓝、红、绿线分别代表由S波接收函数所确定的印度板块、西藏板块和亚洲板块的位置,Moho下方的虚线代表正在俯冲的印度和亚洲岩石圈地幔的顶界面。
Fig.13 P-RF CCP image along INDEPTH profile (adapted after [8-9,21]). Blue, red and green bars below the topographic panel (top) mark the positions of the Indian, Tibetan and Asian Plates, respectively, as determined by the S receiver functions. Black dashed lines below the Moho represent the top interfaces of the subducting Indian and Asian mantle lithospheres.
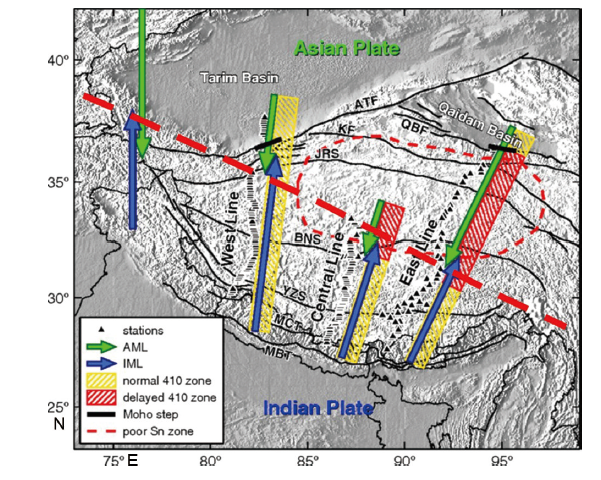
图14 印度板块与欧亚板块在高原之下的碰撞边界(据文献[21,33]) 蓝色和绿色的线段与箭头分别标记观察到的印度(IML)和亚洲(AML)板块的LAB;黄色框标记的观测到的正常的410 km, 而红色方框标记转换震相走时延迟的410 km;黑色线段表示青藏高原北缘Moho深度跳跃的位置;红色虚线标志着Sn波缺失的区域(据文献[33])。QBF:柴达木盆地断裂。
Fig.14 Collision boundary between the Indian and Eurasia continents beneath the Tibetan Plateau (adapted from [21]). Blue and green bars with arrows mark the LAB observations of the Indian and Asian Plates, respectively. Yellow boxes mark the normal observations of the 410 km discontinuity, while red boxes mark the late arrivals of the converted phases from the 410 km discontinuity. Black bars denote sharp step in Moho depth at the northern margins of Tibet. Red dashed line marks zone of poor Sn propagation (adapted from [33]). QBF, Qaidam Basin Fault.
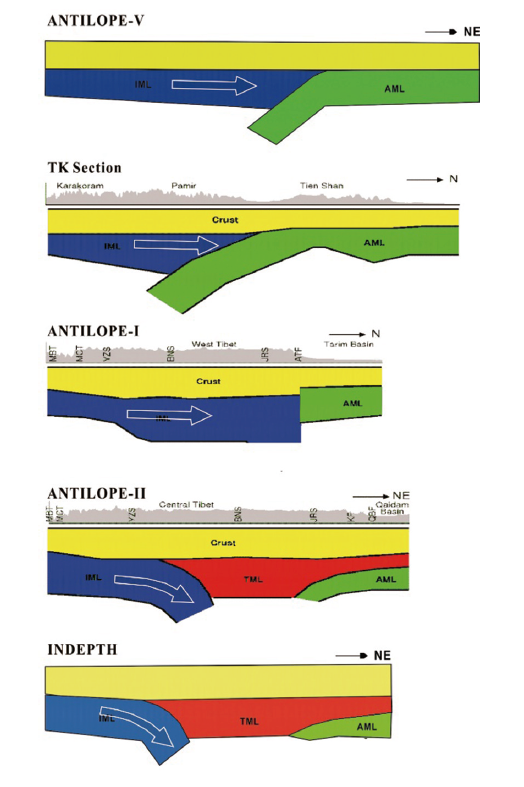
图15 印度、西藏和亚洲地幔岩石圈关系卡通图 该图展示了印度板块俯冲角度与水平距离的东西向变化特点。印度地幔岩石圈标记为蓝色,亚洲地幔岩石圈标记为绿色。红色区域代表破碎带,它是夹持在印度和亚洲板块之间的特殊岩石圈区域。
Fig.15 Relationship between the mantle lithospheres of India, Tibet and Asia, showing the west-east variations of the subduction angle and horizontal advancing distance of the Indian Plate. Blue and green colors represent the Indian and Asian mantle lithospheres, respectively. Red color marks the crash zone, which is a special lithospheric region sandwiched between the Indian and Asian Plates.

图16 青藏高原碰撞板块的构造格局
Fig.16 Tectonic framework of colliding plates in the Tibetan Plateau

图17 观测剖面的位置图 黑线表示剖面位置,红线表示断层。每条剖面上的星号代表爆炸点,红色星号代表确定塔里木盆地和周边造山带关系的爆炸点。TP—青藏高原;TB—塔里木盆地;QB—柴达木盆地;JB—准噶尔盆地;AOB—阿尔泰造山带;CTS—天山中部;ETS—东部天山;AS—阿尔金山;KS—昆仑山;KKS—喀喇昆仑山。
Fig.17 Map of the observation profile locations. Black lines denote the profile locations. Red lines indicate faults. Stars on each profile mark the shot points, with the red ones defining the relationship between the Tarim Basin and the surrounding orogenic belt. TP, Tibetan Plateau; TB, Tarim Basin; QB, Qaidam Basin; JB, Junggar Basin; AOB, Altai orogenic belt; CTS, Central Tien Shan; ETS, Eastern Tien Shan; AS, Altyn Tagh Shan; KS, KunLun Shan; KKS, Karakorum Shan.

图18 沿沙雅-布尔津剖面(XB)的地壳和上地幔顶部的结构与构造解释剖面(据文献[42]) 上图为高程(实线)和布格重力异常(虚线)。下部为岩石圈结构。地震剖面和爆炸点的位置如图17所示。LVZs代表低速区。实线是深地震测深、大地电磁测深和重力反演确定的界面。高倾角线是由地震测深、大地电磁测深和重力分析确定的断层。
Fig.18 Structure of the crust and uppermost mantle and tectonic interpretation along XB line (adapted from [42]). The upper panel shows the elevation (solid line) and Bouguer anomaly (dotted line). The lower panel shows the lithospheric structure. The locations of the seismic section and the shot points are shown in Fig.17. LVZs represent low velocity zones. Interfaces (solid lines) and faults (lines with high angles) are determined by deep seismic sounding, MT sounding, and gravitational inversion.
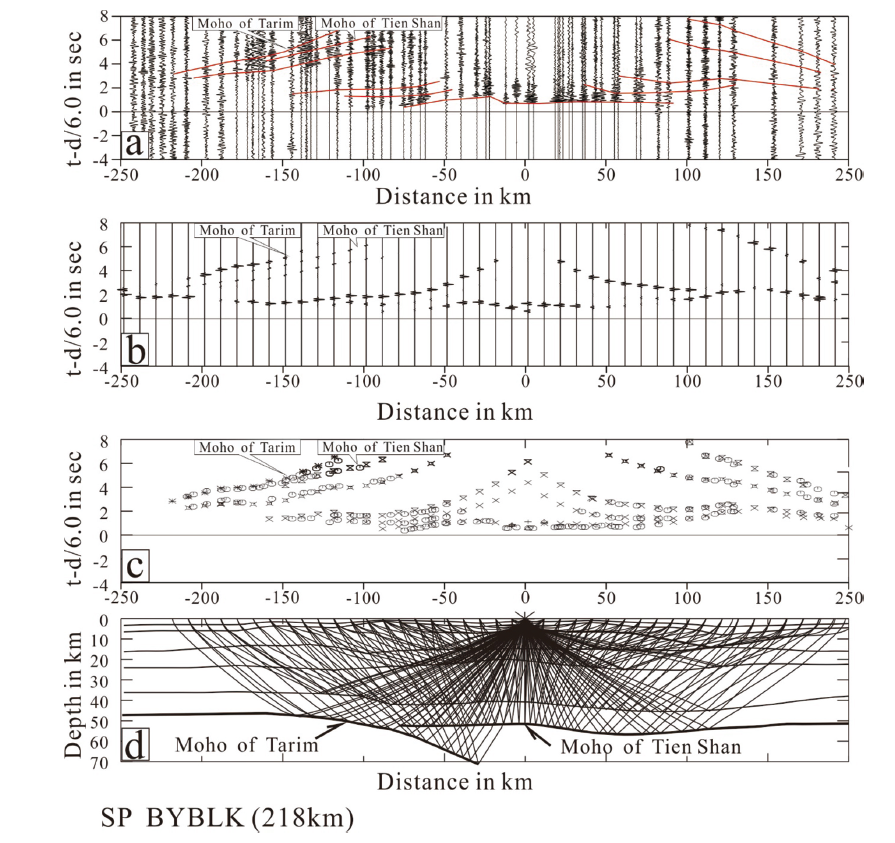
图19 巴音布鲁克爆炸点地震数据及模拟实例 (a) 巴音布鲁克爆炸点折合地震记录截面。爆炸点(0桩号)位于天山造山带南侧(爆炸点位置见图17中红色三角),接收点位于天山造山带的南缘、天山和准噶尔盆地南缘。被记录到的所有的地震信号来自同一个时刻的同一个爆炸点。横轴代表震中距,纵轴为折合走时,折合速度为6 km/s。使用120 Hz的带通滤波器以及窗口为2秒的自动增溢控制。粗实线表示已识别的有效地震相。细线的水平直线为0时刻的参考线。所有观测到的震相的旅行时间构成了射线追踪和合成地震计算的输入数据。(b) 计算理论振幅。(c) 旅行时拟合。实测到时以类椭圆符号表示,理论计算到时用叉型符号表示,二者的旅行时均以6 km/s的速度折合。(d) 射线追踪。纵轴为深度(km),粗线为地震界面,它们由地震震相模拟确定。
Fig.19 Seismic data and modeling example of SP Byblk. (a) Seismic records of SP Byblk. The shot point (at 0 km) is located in the southern part of the Tien Shan Orogenic Belt (see Fig.17 for SP location) and the receivers were deployed in the northern margin of the Tarim Basin, the Tien Shan Orogenic Belt and the southern margin of the Junggar Basin. All recorded seismic signals came from the same shot point at the same moment. The vertical axis indicates the travel time was reduced by 6 km/s. A 1-20 Hz bandpass filter and automatic gain control with 2 s window were applied. The thick solid lines show the identified effective seismic phases. The thin horizontal straight line at time of 0 s is a reference line. Travel times of all observed phases constitute the input data for ray tracing and synthetic seismogram. (b) Calculated theoretical amplitude. (c) Travel time fitting. The measured and calculated travel times reduced by 6 km/s are marked with ellipse and cross symbols, respectively. (d) Ray tracing. The vertical axis indicates depth in km. The thick lines are interfaces determined by modeling of the seismic phases. The horizontal axis indicates offset distance from the shot point.
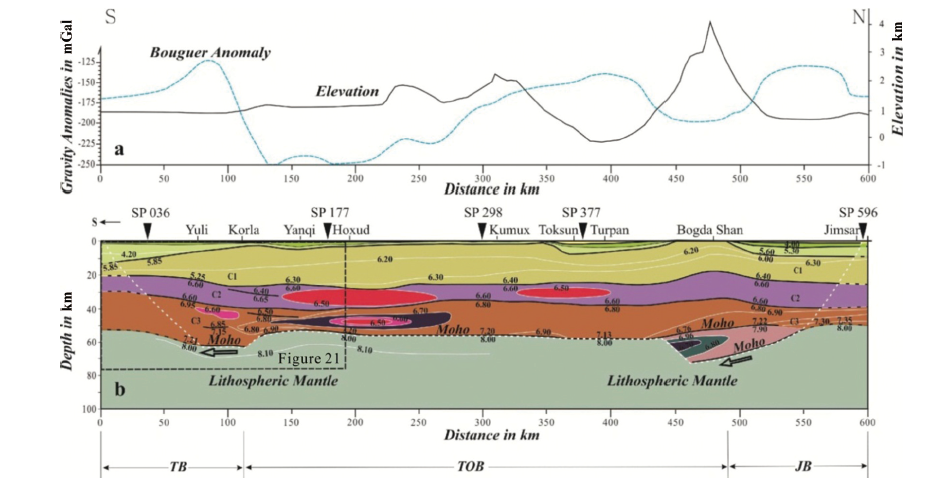
图20 沿库尔勒—吉木萨尔剖面(KJ)的壳幔结构与构造解释剖面 (a)沿剖面的地形起伏(黑色实线)和布格重力异常(蓝色虚线)。(b)沿剖面的速度结构和地球动力学模型。实线是由地震测深和重磁联合反演所确定的界面。剖面顶端的倒三角表示爆炸点。莫霍下面的箭头表示莫霍面的运动方向。细的虚线是速度等值线。地震剖面和炮点的位置见图17。TOB—天山造山带。
Fig.20 Crust-mantle structure and tectonic interpretation along KJ line. (a) Elevation (black solid line) and Bouguer anomaly (blue dotted line) along KJ line. (b) Velocity structure and geodynamic model along this section. Solid lines are interfaces determined by deep seismic sounding and joint inversion of gravity and geomagnetism. Inverted triangles at the top of the profile denote shots. Arrows below the Moho indicate Moho movement direction. Thin dotted lines are velocity contours. Locations of the seismic section and the shot points are shown in Fig.17. TOB, Tien Shan Orogenic Belt.
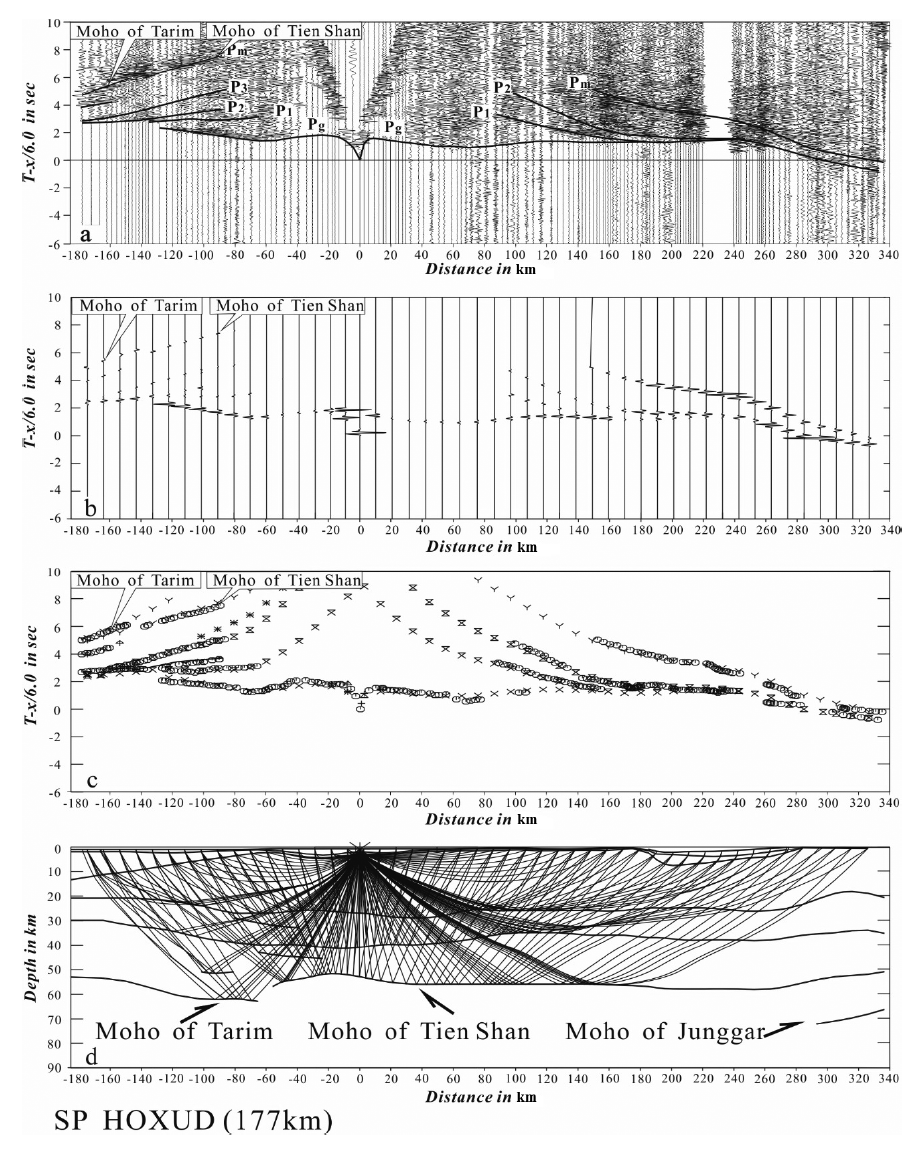
图21 和硕爆炸点地震数据和模拟实例 爆炸点(0 km)位于天山造山带的南部,接收点设置在塔里木盆地的北部边缘,天山造山带和准噶尔盆地的南缘。炮点和地震剖面的位置如图17所示。横轴表示从炮点到接收点的偏移距离。条带图a, b, c, d与图19中描述的相同。
Fig.21 Seismic data and modeling example for SP HOXUD. Shot point (at 0 km) lies in the southern part of Tien Shan Orogenic Belt and the receivers were set up in the northern margin of the Tarim Basin, the Tien Shan Orogenic Belt and the southern margin of the Junggar Basin. Locations of the shot and the seismic section are indicated in Fig.17. The horizontal axis represents offset distance from the shot point. Other descriptions are the sam as those in Fig.19.

图22 沿拜城-大柴旦剖面(BD)的地壳与上地幔顶部速度结构与构造解释剖面(据文献[44]) 方框范围内的精细结构见图23。
Fig.22 Velocity structure of crust and upperomot mantle and tectonic interpretation along BD line (adapted from [44]). The fine structure within the box is shown in Fig.23.

图23 油沙山爆炸点地震数据和模拟实例(据文献[44]) 爆炸点(0 km)位于柴达木盆地阿尔金断裂以南(爆炸点位置见图17)。接收点分布在塔里木盆地、阿尔金山和柴达木盆地。其他图例描述和图19相同。ATR:阿尔金山。
Fig.23 Seismic data and modeling example for SP Yousha Shan (adapted from [44]). The shot point ( at 0 km) is located south of the Altyn Tagh fault in the Qaidam Basin (See Fig.17 for shot point location). The receivers were located in the Tarim Basin, Altyn Tagh Range and Qaidam Basin. Other descriptions are the same as in Fig.19. ATR, Altyn Tagh Range.
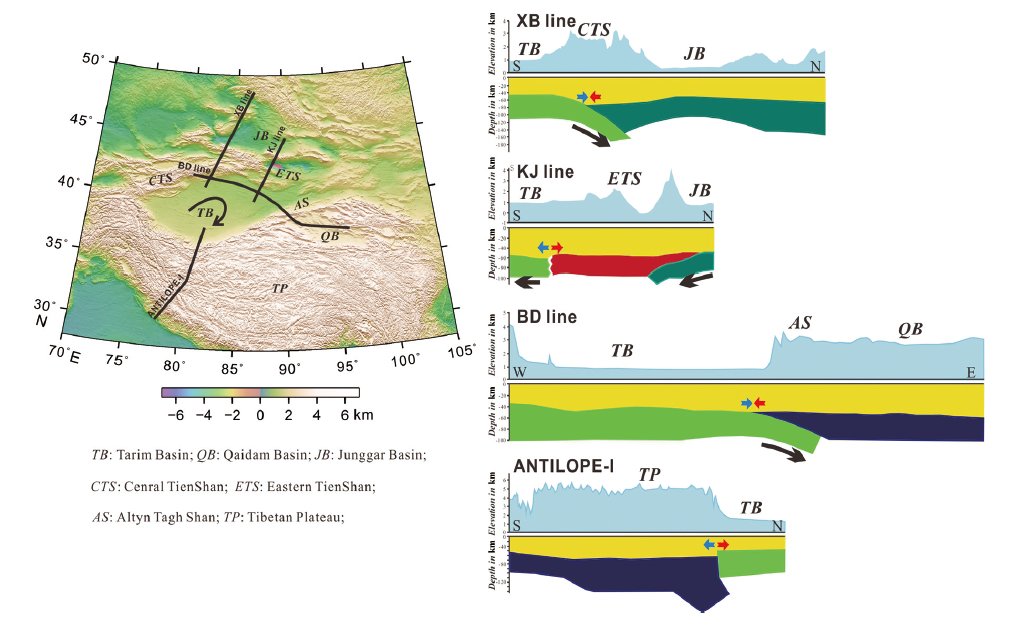
图24 剖面位置(左图)与塔里木地块与周围造山带之间地壳和地幔岩石圈沿4条剖面相互作用的卡通图(右图)(据文献[19]) 地壳均以黄色表示,不同单元的地幔岩石圈以不同颜色表示:塔里木盆地为浅绿色;准噶尔盆地为深绿色;天山为红色;青藏高原为蓝色。黑色箭头表示移动方向。缩写与图17相同。
Fig.24 Map showing the locations of the profiles (left panel) and cartoons of the interaction of the crust and mantle lithosphere between the Tarim Block and the surrounding orogenic belts along four profiles (adapted from [19]). The crust is uniformly shown in yellow, and the mantle lithosphere of different units is shown in different colors: light green for the Tarim Basin, dark green for the Junggar Basin, red for the Tien Shan, and blue for the Tibetan Plateau. Black arrows indicate the moving direction. The acronyms are the same as in Fig.17.
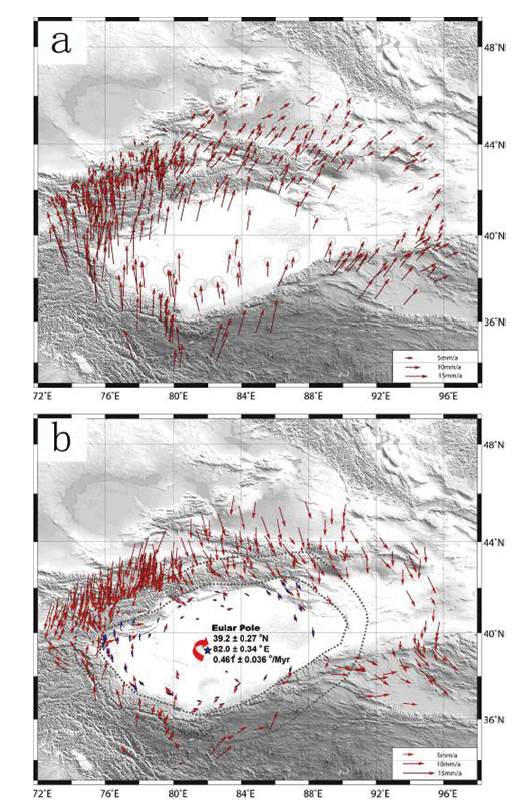
图25 (a)在以稳定的西伯利亚为参照框架中塔里木板块及其周围的GPS速度矢量(红色箭头);(b)在塔里木周边固定参照系中塔里木板块内外的GPS速度矢量(红色箭头)(据文献[19]) 蓝星表示塔里木地块相对于其周围(两个虚线圆之间的区域)顺时针旋转的欧拉极点位置。蓝色矢量是模拟计算得到的GPS速度。
Fig.25 (a) GPS velocity vectors (red arrows) in and around the Tarim Block in a reference frame of the stable Siberia, and (b) GPS velocity vectors (red arrows) in and around the Tarim block in the “Tarim surrounding vicinity fixed reference frame”. Adapted from [19]. The blue star indicates the Euler pole location of the clockwise rotation of the Tarim Block with respect to its surroundings. The blue vectors are the GPS velocity calculated by the simulation. Detailed interpretation can refer to [19].
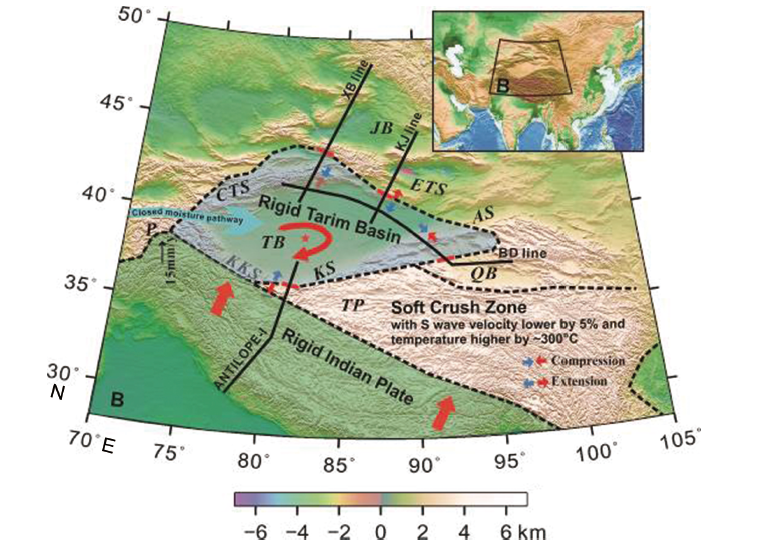
图26 中国西部板块构造格局(据文献[19]) 实线表示地震剖面的位置。塔里木盆地边缘的红色粗线段表示沿四个剖面的塔里木板块岩石圈外缘。蓝色和红色箭头对表示压缩或扩展的应力环境。红星表示欧拉极位置,塔里木板块围绕欧拉极有规律地旋转。
Fig.26 Plate tectonic pattern in western China (adapted from [19]). Solid lines indicate the location of seismic profiles. The thick red lines mark the outer margin of the Tarim Plate lithosphere along four sections. Blue and red arrows indicate compressive or extensional stress environments. The red star indicates the position of the Euler pole, around which the Tarim Plate rotates regularly.
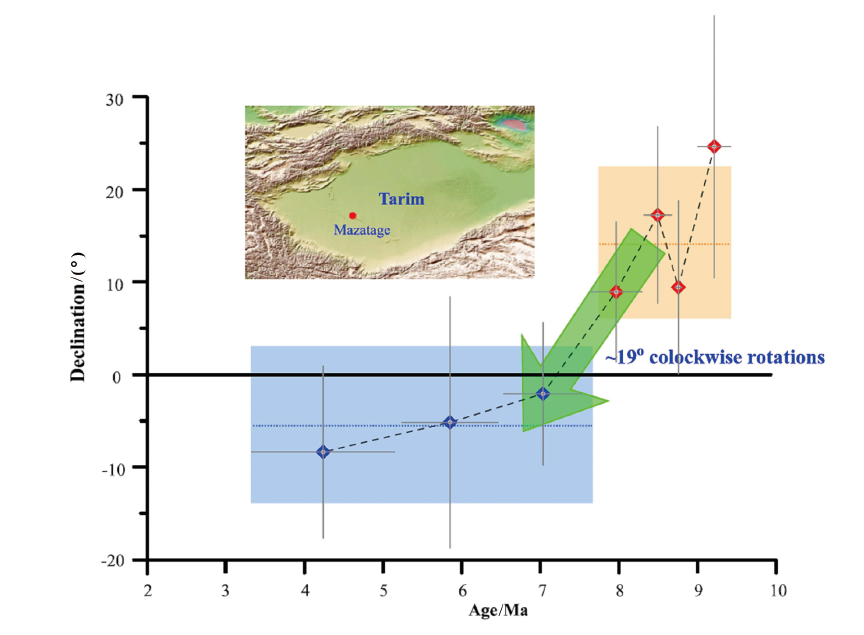
图27 塔里木盆地中部Mazatage区域新近纪晚期古地磁偏角和磁地层年龄
Fig.27 Paleomagnetic declination and magnetostratigraphic age of the late Neogene in the Mazatage region of the central Tarim Basin

图28 渐新世早期生态系统重建 左图为准噶尔盆地以啮齿动物/兔形目动物为主要动物群的干-温的草原环境,右图为蒙古高原以奇蹄动物/偶蹄动物群为主宰的温暖潮湿的森林环境。
Fig.28 Ecosystem reconstruction in the early Oligocene. The left panel shows a dry-warm steppe environment dominated by rodent/lagomorph faunas in the Junggar Basin, while the right panel shows a warm-humid forest environment dominated by perissodactyl/artiodactyl faunas in Mongolia.
| [1] |
DING L, MAKSATBEK S, CAI F L, et al. Processes of initial collision and suturing between India and Asia[J]. Science China Earth Sciences, 2017, 60(4):635-651.
DOI URL |
| [2] | ARGAND E. La tectonique de l’Asie[C]. Brussels: 13th Int. Geological Congress, 1924, 1(5):171-372. |
| [3] |
WILLETT S D, BEAUMONT C. Subduction of Asian lithospheric mantle beneath Tibet inferred from models of continental collision[J]. Nature, 1994, 369:642-645.
DOI URL |
| [4] |
MATTE P H, TAPPONNIER P, ARNAUD N, et al. Tectonics of Western Tibet, between the Tarim and Indus[J]. Earth and Planetary Science Letters, 1996, 142(3/4):311-330.
DOI URL |
| [5] |
YIN A, HARRISON T M. Geologic evolution of the Himalayan-Tibetan orogeny[J]. Annual Review of Earth and Planetary Sciences, 2000, 28:211-280.
DOI URL |
| [6] |
TAPPONNIER P, XU Z Q, ROGER F, et al. Oblique stepwise rise and growth of the Tibet plateau[J]. Science, 2001, 294(5547):1671-1677.
DOI URL |
| [7] |
CLARK M K, ROYDEN L. Topographic ooze: building the eastern margin of Tibet by lower crustal flow[J]. Geology, 2000, 28:703-706.
DOI URL |
| [8] |
KIND R, YUAN X H, SAUL J, et al. Seismic images of crust and upper mantle beneath Tibet: evidence for Eurasian plate subduction[J]. Science, 2002, 298:1219-1221.
DOI URL |
| [9] | KUMAR P, YUAN X H, KIND R, et al. Imaging the colliding Indian and Asian lithospheric plates beneath Tibet[J]. Journal of Geophysical Research: Solid Earth, 2006, 111, B06308. |
| [10] |
GAO R, LU Z W, KLEMPERER S, et al. Crustal-scale duplexing beneath the Yarlung Zangbo suture in the western Himalaya[J]. Nature Geoscience, 2016, 9:555-560.
DOI URL |
| [11] | 钟大赉, 丁林. 青藏高原的隆起过程及其机制探讨[J]. 中国科学:D辑, 1996, 26(4):289-295. |
| [12] | WANG C S, ZHAO X X, LIU Z F, et al. Constraints on the early uplift history of the Tibetan Plateau[J]. Proceedings of the National Academy of Sciences of the United States of America, 2008, 105(13), 4987-4992. |
| [13] | 张培震, 王琪, 马宗晋. 青藏高原现今构造变形特征与GPS速度场[J]. 地学前缘, 2002, 9(2):442-450. |
| [14] | 许志琴, 杨经绥, 姜枚, 等. 大陆俯冲作用及青藏高原周缘造山带的崛起[J]. 地学前缘, 1999, 6(3):139-152. |
| [15] | 吴福元, 黄宝春, 叶凯, 等. 青藏高原造山带的垮塌与高原隆升[J]. 岩石学报, 2008, 24(1):1-30. |
| [16] |
ZHENG Y F, ZHAO Z F, CHEN Y X. Continental subduction channel processes: plate interface interaction during continental collision[J]. Chinese Science Bulletin, 2013, 58:4371-4377.
DOI URL |
| [17] |
KUFNER S K, SCHURR B, SIPPL C, et al. Deep India meets deep Asia: lithospheric indentation, delamination and break-off under Pamir and Hindu Kush (Central Asia)[J]. Earth and Planetary Science Letters, 2016, 435:171-184.
DOI URL |
| [18] | XU Q, ZHAO J M, YUAN X H, et al. Deep crustal contact between the Pamir and Tarim Basin deduced from receiver functions[J]. Geophysical Research Letters, 2021, 48(9):1-8. |
| [19] |
ZHAO J M, ZHANG P Z, YUAN X H, et al. Clockwise rotation of the Tarim Basin driven by the Indian plate impact[J]. Earth Sciences and Subsoil Use, 2019, 42(4):425-436.
DOI URL |
| [20] |
KUMAR P, YUAN X H, KIND R, et al. The lithosphere-asthenosphere boundary in the Tien Shan - Karakoram region from S receiver functions: evidence for continental subduction[J]. Geophysical Research Letters, 2005, 32(7). DOI: org/10.1029/2004GL022291.
DOI |
| [21] | ZHAO J M, YUAN X H, LIU H B, et al. The boundary between the Indian and Asian tectonic plates below Tibet[J]. Proceedings of the National Academy of Sciences of the United States of America, 2010, 107(25):11229-11233. |
| [22] |
ZHANG Z J, YUAN X H, CHEN Y, et al. Seismic signature of the collision between the east Tibetan escape flow and the Sichuan Basin[J]. Earth and Planetary Science Letters, 2010, 292(3):254-264.
DOI URL |
| [23] |
WITTLINGER G, VERGNE J, TAPPONNIER P, et al. Teleseismic imaging of subducting lithosphere and Moho offsets beneath western Tibet[J]. Earth and Planetary Science Letters, 2004, 221(1):117-130.
DOI URL |
| [24] |
ZHU L, HELMBERGER D V. Moho offset across the northern margin of the Tibetan Plateau[J]. Science, 1998, 281(5380):1170-1172.
DOI URL |
| [25] |
SHI D, SHEN Y, ZHAO W J, et al. Seismic evidence for a Moho offset and south-directed thrust at the easternmost Qaidam-Kunlun boundary in the northeast Tibetan Plateau[J]. Earth and Planetary Science Letters, 2009, 288(1-2):329-334.
DOI URL |
| [26] | YUAN X H, NI J, KIND R, et al. Lithospheric and upper mantle structure of southern Tibet from a seismological passive source experiment[J]. Journal of Geophysical Research: Solid Earth, 1997, 102:27491-27500. |
| [27] |
WITTLINGER G, FARRA V, HETÉNYI G , et al. Seismic velocities in southern Tibet lower crust: a receiver function approach for eclogite detection[J]. Geophysical Journal International, 2009, 177:1037-1049.
DOI URL |
| [28] |
NÁB E ˙LEK J, HETÉNYI G, VERGNE J, et al. Underplating in the Himalaya-Tibet collision zone revealed by the Hi-CLIMB experiment[J]. Science, 2009, 325(5946):1371-1374.
DOI URL |
| [29] |
HELFFRICH G. Topography of the transition zone seismic discontinuities[J]. Reviews of Geophysics, 2000, 38(1):141-158.
DOI URL |
| [30] |
KARATO S I. Importance of anelasticity in the interpretation of seismic tomography[J]. Geophysical Research Letters, 1993, 20(15):1623-1626.
DOI URL |
| [31] |
GUO X Y, GAO R, ZHAO J M, et al. Deep-seated lithospheric geometry in revealing collapse of the Tibetan Plateau[J]. Earth-Science Reviews, 2018, 185:751-762.
DOI URL |
| [32] |
LI C, VAN DER HILST R D, MELTZER A S , et al. Subduction of the Indian lithosphere beneath the Tibetan Plateau and Burma[J]. Earth and Planetary Science Letters, 2008, 274:157-168.
DOI URL |
| [33] |
BARAZANGI M, NI J. Velocities and propagation characteristics of Pn and Sn beneath the Himalayan arc and Tibetan plateau: possible evidence for underthrusting of Indian continental lithosphere beneath Tibet[J]. Geology, 1982, 10(4):179-185.
DOI URL |
| [34] |
KIND R, YUAN X H. Seismic images of the biggest crash on earth[J]. Science, 2010, 329(5998):1479-1480.
DOI URL |
| [35] |
TAPPONNIER P, PELZER G, LE DAIN A Y , et al. Propagating extrusion tectonics in Asia: new insights from simple experiments with plasticine[J]. Geology, 1982, 10(12):611-616.
DOI URL |
| [36] |
HOUSEMAN G, ENGLAND P. Crustal thickening versus lateral expulsion in the Indian-Asian continental collision[J]. Journal of Geophysical Research, 1993, 98(B7):12233-12249.
DOI URL |
| [37] | 钱祥麟. 新生代板内造山作用研究: 认识中国区域地质构造基本特征的关键[J]. 地学前缘, 2004, 11(3):221-225. |
| [38] |
MOLNAR P, TAPPONNIER P. Cenozoic tectonics of Asia: effects of a continental collision[J]. Science, 1975, 189:419-426.
DOI URL |
| [39] |
SUN J M, LIU T. The age of the taklimakan desert[J]. Science, 2006, 312(5780):1621-1621.
DOI URL |
| [40] |
SUN J M, ZHANG L Y, DENT C L, et al. Evidence for enhanced aridity in the Tarim Basin of China since 5.3 Ma[J]. Quaternary Science Reviews, 2008, 27(9/10):1012-1023.
DOI URL |
| [41] |
AVOUAC P, TAPPONNIER P. Kinematic model of active deformation in central Asia[J]. Geophysical Research Letters, 1993, 20(10):895-898.
DOI URL |
| [42] |
ZHAO J M, LIU G D, LU Z X, et al. Lithospheric structure and dynamic processes of the Tianshan Orogenic Belt and the Junggar Basin[J]. Tectonophysics, 2003, 376(3/4):199-239.
DOI URL |
| [43] | 赵俊猛. 天山造山带岩石圈结构与动力学[M]. 北京: 地震出版社, 2005: 1-251. |
| [44] |
ZHAO J M, MOONEY W D, ZHANG X K, et al. Crustal structure across the Altyn Tagh Range at the northern margin of the Tibetan plateau and tectonic implications[J]. Earth and Planetary Science Letters, 2006, 241:804-814.
DOI URL |
| [45] | ZHAO J M, SHAH S, ZHANG H, et al. Density and magnetic intensity of the crust and uppermost mantle across the northern margin of the Tibetan Plateau[J]. Physics of the Earth & Planetary Interiors, 2017, 265:15-22. |
| [46] | 赵俊猛, 金之钧, 刘训. 中国西北部拜城-大柴旦地学断面[M]. 北京: 科学出版社, 2010: 1-64. |
| [47] |
ZHENG G, WANG H, WRIGHT T J, et al. Crustal deformation in the India-Eurasia collision zone from 25 years of GPS measurements[J]. Journal of Geophysical Research: Solid Earth, 2017, 122(11), 9290-9312.
DOI URL |
| [48] |
LI Q, YOU X Z, YANG S M, et al. A precise velocity field of tectonic deformation in China as inferred from intensive GPS observations[J]. Science China: Earth Sciences, 2012, 55(5):695-698.
DOI URL |
| [49] | ZUBOVICH A V, WANG X Q, SCHERBA Y G, et al. GPS velocity field for the Tien Shan and surrounding regions[J]. Tectonics 29, 2010, TC6014. |
| [50] |
CHEN Y, COGNE J P, COURTILLOT V, et al. New Cretaceous paleomagnetic poles from the Tarim Basin, northwestern China[J]. Earth and Planetary Science Letters, 1992, 114(1):17-38.
DOI URL |
| [51] |
CHEN W P, MARTIN M, TSENG T L, et al. Shear-wave birefringence and current configuration of converging lithosphere under Tibet[J]. Earth and Planetary Science Letters, 2010, 295(1-2):297-304.
DOI URL |
| [52] |
DING L, QASIM M, JADOON I A K, et al. The India-Asia collision in north Pakistan: insight from the U-Pb detrital zircon provenance of Cenozoic foreland basin[J]. Earth and Planetary Science Letters, 2016, 455:49-61.
DOI URL |
| [53] | BURTMAN V S, MOLNAR P. Geological and geophysical evidence for deep subduction of continental crust beneath the Pamir[J]. Geological Society of America Special Paper, 1993, 281:76. |
| [54] |
SUN J M, LIU W, LIU Z, et al. Extreme aridification since the beginning of the pliocene in the Tarim Basin, western China[J]. Palaeogeography, Palaeoclimatology, Palaeoecology, 2017, 485:189-200.
DOI URL |
| [55] |
YE J, WU W Y, NI X J, et al. The Duolebulejin section of northern Junggar Basin and its stratigraphic and environmental implication[J]. Scientia Sinica Terrae, 2012, 42:1523-1532.
DOI URL |
| [56] |
SUN J M, NI X J, BI S D, et al. Synchronous turnover of flora, fauna, and climate at the Eocene-Oligocene boundary in Asia[J]. Scientific Reports, 2014, 4:7463.
DOI URL |
| [57] |
MENG J, MCKENNA M C. Faunal turnovers of Palaeogene mammal from the Mongolian Plateau[J]. Nature, 1998, 394:364-367.
DOI URL |
| [58] | 王伴月, 常江, 孟宪家, 等. 内蒙千里山地区中、上渐新统的发现及其意义[J]. 古脊椎动物与古人类, 1981, 19(1):26-34. |
| [1] | 杨文采. 固体地球物理学与板块大地构造学的交汇[J]. 地学前缘, 20140101, 21(1): 89-99. |
| [2] | 刘玲霞, 路睿, 谢文苹, 刘博, 王亚茹, 姚海慧, 蔺文静. 青藏高原东北部温泉分布及水文地球化学特征[J]. 地学前缘, 2024, 31(6): 173-195. |
| [3] | 谷雨, 吴俊, 樊太亮, 吕峻岭. 塔北-塔中地区中、下寒武统岩性组合与变形特征及其对油气输导影响[J]. 地学前缘, 2024, 31(5): 313-331. |
| [4] | 李凤磊, 林承焰, 任丽华, 张国印, 关宝珠. 塔里木盆地塔北地区多期断裂差异匹配控制下超深岩溶缝洞储层成藏特征[J]. 地学前缘, 2024, 31(4): 219-236. |
| [5] | 陈昌锦, 程晓敢, 林秀斌, 李丰, 田禾丰, 屈梦雪, 孙思瑶. 基于弹性板模型的塔里木盆地北部新生代沉降模拟:对南天山隆升的启示[J]. 地学前缘, 2024, 31(4): 340-353. |
| [6] | 张爱奎, 袁万明, 刘光莲, 张勇, 汪周鑫, 孙非非, 刘智刚. 柴达木盆地周缘战略性金属矿产成矿规律与勘查方向[J]. 地学前缘, 2024, 31(3): 260-283. |
| [7] | 王俊鹏, 曾联波, 徐振平, 王珂, 曾庆鲁, 张知源, 张荣虎, 蒋俊. 成岩流体对超深致密砂岩储层构造裂缝充填及溶蚀改造的影响:以塔里木盆地克拉苏油气田为例[J]. 地学前缘, 2024, 31(3): 312-323. |
| [8] | 徐兆辉, 胡素云, 曾洪流, 马德波, 罗平, 胡再元, 石书缘, 陈秀艳, 陶小晚. 塔里木盆地肖尔布拉克组上段烃源岩分布预测及油气勘探意义[J]. 地学前缘, 2024, 31(2): 343-358. |
| [9] | 刘德民, 王杰, 姜淮, 赵悦, 郭铁鹰, 杨巍然. 青藏高原形成演化动力机制及其远程效应[J]. 地学前缘, 2024, 31(1): 154-169. |
| [10] | 刘丛强, 李思亮, 刘学炎, 王宝利, 郎赟超, 丁虎, 郝丽萍, 张琼予. 人类世生物地球化学循环及其科学[J]. 地学前缘, 2024, 31(1): 455-466. |
| [11] | 李丹, 常健, 邱楠生, 熊昱杰. 塔里木盆地台盆区超深层热演化及对储层的影响[J]. 地学前缘, 2023, 30(6): 135-149. |
| [12] | 陈践发, 许锦, 王杰, 刘鹏, 陈斐然, 黎茂稳. 塔里木盆地西北缘玉尔吐斯组黑色岩系沉积环境演化及其对有机质富集的控制作用[J]. 地学前缘, 2023, 30(6): 150-161. |
| [13] | 邱楠生, 常健, 冯乾乾, 曾帅, 刘效妤, 李慧莉, 马安来. 我国中西部盆地深层-超深层烃源岩热演化研究[J]. 地学前缘, 2023, 30(6): 199-212. |
| [14] | 陈泽亚, 陈践发, 黎茂稳, 付娆, 师肖飞, 徐学敏, 伍建军. 塔里木台盆区下古生界天然气甲烷氢同位素组成特征及地质意义[J]. 地学前缘, 2023, 30(6): 232-246. |
| [15] | 马安来, 漆立新. 顺北地区四号断裂带奥陶系超深层油气地球化学特征与相态差异性成因[J]. 地学前缘, 2023, 30(6): 247-262. |
| 阅读次数 | ||||||
|
全文 |
|
|||||
|
摘要 |
|
|||||