地学前缘 ›› 2025, Vol. 32 ›› Issue (2): 412-429.DOI: 10.13745/j.esf.sf.2024.5.27
张一帆1,2( ), 刘海燕1,2,*(), 董姝1,2, 郭华明3, 王振1,2, 孙占学1,2, 周仲魁1,2
收稿日期:2024-01-18
修回日期:2024-04-10
出版日期:2025-03-25
发布日期:2025-03-25
通信作者:
*刘海燕(1988—)男,博士,副教授,主要从事水文地球化学研究工作。E-mail: hy_liu@ecut.edu.cn
作者简介:张一帆(1998—),男,硕士研究生,主要从事水文地球化学研究工作。E-mail: 1260973971@qq.com
基金资助:
ZHANG Yifan1,2(), LIU Haiyan1,2,*(), DONG Shu1,2, GUO Huaming3, WANG Zhen1,2, SUN Zhanxue1,2, ZHOU Zhongkui1,2
Received:2024-01-18
Revised:2024-04-10
Online:2025-03-25
Published:2025-03-25
摘要:
酸性矿山排水(AMD)因化学毒性和生态环境危害受到世界广泛关注。本文以相山铀矿尾矿排水及其下游沉积物为研究对象,沿矿山排水排泄方向采集了22个AMD和31个沉积物样品,通过室内室外试验综合分析,探究了AMD和沉积物中稀土元素(REEs)的含量和分异特征及其控制因素。研究表明,AMD的pH为3.65~6.24(平均值4.51),水化学类型为单一的SO42--Ca型水,REEs浓度总量(ΣREEs)为0.41~191.23 μg/L(平均值80.32 μg/L),pH值与ΣREEs浓度呈负相关关系,是控制REEs浓度的重要因素;PHREEQC模拟显示,水中REEs以SO42-络合态和自由态为主(>99%);上陆壳(UCC)归一化结果显示,水样呈重稀土元素(HREEs)相对于轻稀土元素(LREEs)富集,Ce负异常。沉积物ΣREEs含量为170.58~1 259.18 μg/g,随深度增加,ΣREEs含量逐渐递减;浅层沉积物具有与水样相似的HREEs富集归一化模式;尾矿内沉积物HREEs富集程度比下游沉积物更加显著;尾矿库下游沉积物随采样深度的增加,HREEs富集程度逐渐减弱,最后演变成平坦型或LREEs归一化模式。沉积物-硫酸(1∶40)酸浸试验结果显示,浸出液REEs归一化模式与酸性排水相似,为HREEs富集。指示在矿山酸水形成过程中,HREEs优先于LREEs进入水体中,浅层沉积物继承了矿山酸水REEs含量特性。但是,REEs由表层往深部迁移的过程中发生了分异,HREEs相对于LREEs优先迁移,导致沉积物REEs分布模式在垂向上具有明显的演化趋势。本研究成果对铀矿山环境演化及水土污染防治具有重要意义。
中图分类号:
张一帆, 刘海燕, 董姝, 郭华明, 王振, 孙占学, 周仲魁. 相山铀矿尾矿区酸性矿山排水和沉积物稀土元素地球化学特征[J]. 地学前缘, 2025, 32(2): 412-429.
ZHANG Yifan, LIU Haiyan, DONG Shu, GUO Huaming, WANG Zhen, SUN Zhanxue, ZHOU Zhongkui. Geochemical characteristics of rare earth elements in acid mine drainage and sediments from the Xiangshan uranium mine tailings area[J]. Earth Science Frontiers, 2025, 32(2): 412-429.

图1 研究区地质简图(a)及采样点分布图(b)
Fig.1 Geological map of the study area (a) and sampling locations (b)
| 采样点 | 采样位置 | 采样点 | 采样位置 |
|---|---|---|---|
| S1 | 尾矿库坝底水处理厂内的水体 | K1 | S2水体下的沉积物,上层均为细砂,最下层为粉土 |
| S2 | 经水处理厂处理后排出的水体 | K2 | S4水体下的沉积物,前三层为粉土,下两层为黏土 |
| S3 | 尾矿库坝底未经水处理厂处理的水体 | K3 | S6水体下的沉积物,粉土 |
| S4 | S2、S3混合后的水体 | K4 | S7水体下的沉积物,粉土 |
| S5~S9 | S4下游水渠中不同距离的水体 | K5 | S9水体下的沉积物,粉土 |
| S10 | 尾矿库坝底渗滤液收集池内的水体 | K6 | 与S10同位于渗滤液收集池内,黏土 |
| D1 | 尾矿库内水库的水体 | XS1 | 尾矿库内的沉积物,黏土 |
| D2 | 经水处理厂处理后排出的水体 | XS2 | 尾矿库内的沉积物,上层为粉土,下层为黏土 |
| H1~H9 | 水渠内不同距离的水体 | XS3 | 尾矿库坝旁边的沉积物,前三层为细砂,下层为粉土 |
| H10 | 经H9后排放至农田内的水体 | XS4 | 尾矿库坝底的沉积物,粉土 |
表1 水样和沉积物样品及其基本特征
Table 1 Water and sediment samples and their basic characteristics
| 采样点 | 采样位置 | 采样点 | 采样位置 |
|---|---|---|---|
| S1 | 尾矿库坝底水处理厂内的水体 | K1 | S2水体下的沉积物,上层均为细砂,最下层为粉土 |
| S2 | 经水处理厂处理后排出的水体 | K2 | S4水体下的沉积物,前三层为粉土,下两层为黏土 |
| S3 | 尾矿库坝底未经水处理厂处理的水体 | K3 | S6水体下的沉积物,粉土 |
| S4 | S2、S3混合后的水体 | K4 | S7水体下的沉积物,粉土 |
| S5~S9 | S4下游水渠中不同距离的水体 | K5 | S9水体下的沉积物,粉土 |
| S10 | 尾矿库坝底渗滤液收集池内的水体 | K6 | 与S10同位于渗滤液收集池内,黏土 |
| D1 | 尾矿库内水库的水体 | XS1 | 尾矿库内的沉积物,黏土 |
| D2 | 经水处理厂处理后排出的水体 | XS2 | 尾矿库内的沉积物,上层为粉土,下层为黏土 |
| H1~H9 | 水渠内不同距离的水体 | XS3 | 尾矿库坝旁边的沉积物,前三层为细砂,下层为粉土 |
| H10 | 经H9后排放至农田内的水体 | XS4 | 尾矿库坝底的沉积物,粉土 |
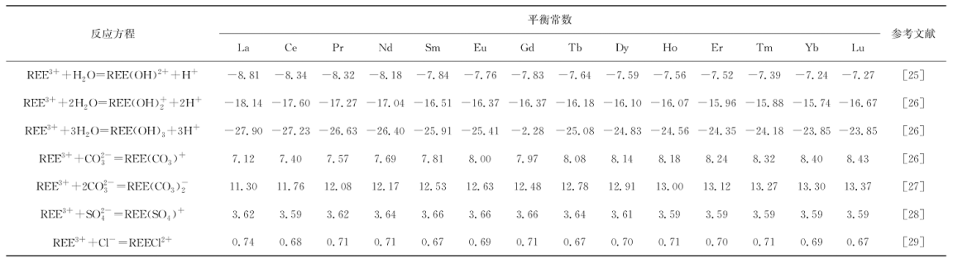 |
表2 加入至 PHREEQC数据库 WATEQ4F 中的REEs与阴离子络合反应稳定参数(离子强度IS=0,温度25℃)
Table 2 Chemical equations and equilibrium constants for REE-anion complexation reactions which were added to the WATEQ4F database in PHREEQCcalculation(IS=0, temperature 25℃)
| |
| 时间 | 统计量 | pH | 离子浓度/(mg·L-1) | |||||||
|---|---|---|---|---|---|---|---|---|---|---|
| TDS | K | Ca | Na | Mg | Cl- | SO42- | HCO3- | |||
| 2022-11 | 最大值 | 4.23 | 1 552 | 26.49 | 470.75 | 63.65 | 18.73 | 7.08 | 474.63 | 32.02 |
| 最小值 | 3.65 | 1 037 | 18.79 | 356.32 | 45.40 | 10.18 | 4.95 | 225.95 | - | |
| 平均值 | 3.981 | 1 266.11 | 22.70 | 419.02 | 54.96 | 15.07 | 6.12 | 316.58 | 3.20 | |
| 2023-06 | 最大值 | 6.90 | 415.00 | 9.02 | 116.57 | 25.86 | 12.60 | 18.02 | 385.81 | 39.30 |
| 最小值 | 4.24 | 303.00 | 3.46 | 97.45 | 11.08 | 10.41 | 5.53 | 291.45 | 1.46 | |
| 平均值 | 4.85 | 379.42 | 5.35 | 111.31 | 13.77 | 11.76 | 15.10 | 359.69 | 9.74 | |
表3 研究区水样水化学组分
Table 3 Hydrochemical components of water samples in the study area
| 时间 | 统计量 | pH | 离子浓度/(mg·L-1) | |||||||
|---|---|---|---|---|---|---|---|---|---|---|
| TDS | K | Ca | Na | Mg | Cl- | SO42- | HCO3- | |||
| 2022-11 | 最大值 | 4.23 | 1 552 | 26.49 | 470.75 | 63.65 | 18.73 | 7.08 | 474.63 | 32.02 |
| 最小值 | 3.65 | 1 037 | 18.79 | 356.32 | 45.40 | 10.18 | 4.95 | 225.95 | - | |
| 平均值 | 3.981 | 1 266.11 | 22.70 | 419.02 | 54.96 | 15.07 | 6.12 | 316.58 | 3.20 | |
| 2023-06 | 最大值 | 6.90 | 415.00 | 9.02 | 116.57 | 25.86 | 12.60 | 18.02 | 385.81 | 39.30 |
| 最小值 | 4.24 | 303.00 | 3.46 | 97.45 | 11.08 | 10.41 | 5.53 | 291.45 | 1.46 | |
| 平均值 | 4.85 | 379.42 | 5.35 | 111.31 | 13.77 | 11.76 | 15.10 | 359.69 | 9.74 | |
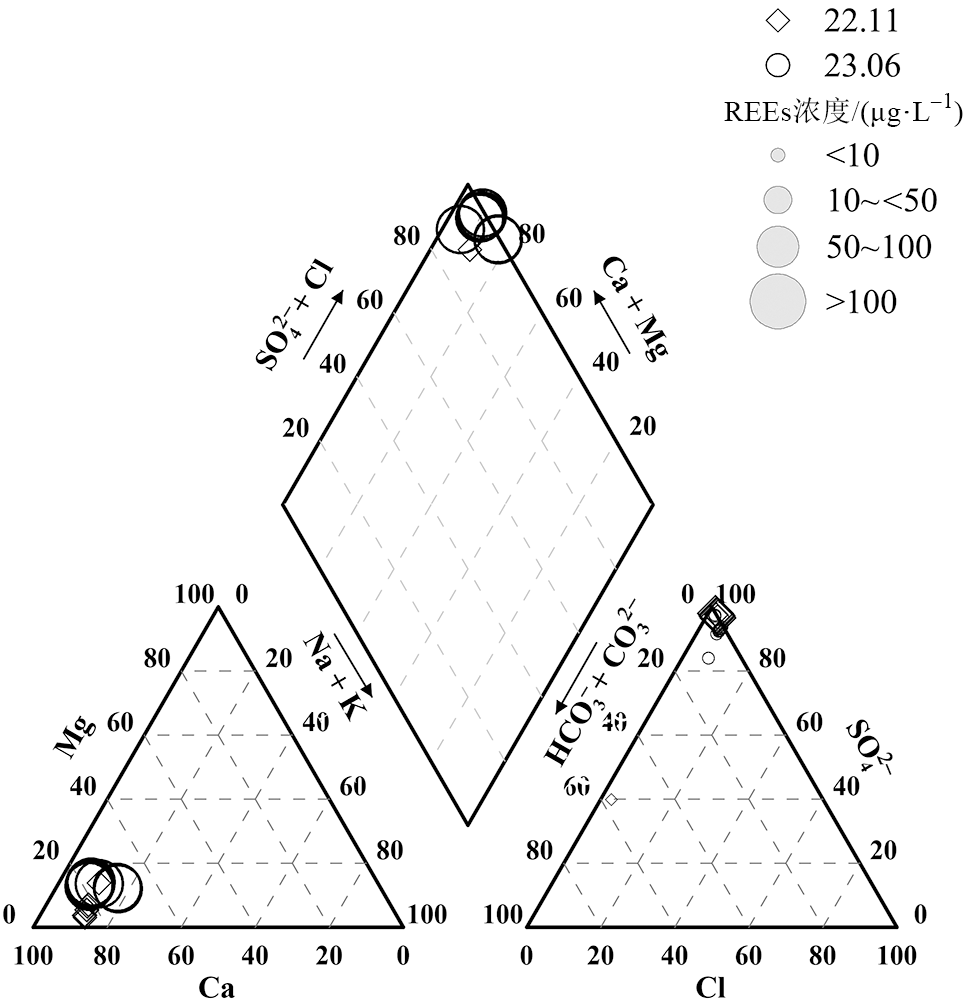
图2 研究区水样Piper三线图
Fig.2 Piper plot of water samples in the study area
| 时间 | 统计量 | pH | 离子浓度/(μg·L-1) | ||||||
|---|---|---|---|---|---|---|---|---|---|
| Al | Fe | Mn | Ni | As | Cd | Pb | |||
| 2022-11 | 最大值 | 4.23 | 400.91 | 76.39 | 1 294.56 | 2.70 | 2.18 | 0.21 | 0.45 |
| 最小值 | 3.65 | 31.42 | 2.26 | 86.72 | 0.57 | 0.15 | 0.02 | 0.01 | |
| 平均值 | 3.98 | 258.04 | 50.75 | 725.25 | 1.34 | 0.96 | 0.09 | 0.18 | |
| 2023-06 | 最大值 | 6.90 | 5 190.55 | 733.44 | 8 960.11 | 17.10 | 1.36 | 0.92 | 1.15 |
| 最小值 | 4.24 | 102.14 | 20.00 | 730.73 | 2.38 | 0.63 | 0.09 | 0.09 | |
| 平均值 | 4.85 | 3 704.66 | 481.49 | 3 910.57 | 12.97 | 0.82 | 0.64 | 0.40 | |
表4 研究区水样中金属元素浓度统计
Table 4 Statistics of metal element concentrations in water samples from the study area
| 时间 | 统计量 | pH | 离子浓度/(μg·L-1) | ||||||
|---|---|---|---|---|---|---|---|---|---|
| Al | Fe | Mn | Ni | As | Cd | Pb | |||
| 2022-11 | 最大值 | 4.23 | 400.91 | 76.39 | 1 294.56 | 2.70 | 2.18 | 0.21 | 0.45 |
| 最小值 | 3.65 | 31.42 | 2.26 | 86.72 | 0.57 | 0.15 | 0.02 | 0.01 | |
| 平均值 | 3.98 | 258.04 | 50.75 | 725.25 | 1.34 | 0.96 | 0.09 | 0.18 | |
| 2023-06 | 最大值 | 6.90 | 5 190.55 | 733.44 | 8 960.11 | 17.10 | 1.36 | 0.92 | 1.15 |
| 最小值 | 4.24 | 102.14 | 20.00 | 730.73 | 2.38 | 0.63 | 0.09 | 0.09 | |
| 平均值 | 4.85 | 3 704.66 | 481.49 | 3 910.57 | 12.97 | 0.82 | 0.64 | 0.40 | |
| 采样时间 | 统计量 | 离子浓度/(μg·L-1) | LREE/HREE | δCe | δEu | (Yb/Nd)UCC | |||
|---|---|---|---|---|---|---|---|---|---|
| ΣREE | LREE | MREE | HREE | ||||||
| 2022-03 | 最小值 | 12.11 | 9.12 | 1.98 | 1.00 | 9.08 | 0.16 | 0.96 | 0.83 |
| 最大值 | 191.23 | 149.08 | 29.08 | 13.07 | 14.41 | 0.33 | 1.02 | 1.37 | |
| 平均值 | 82.60 | 64.97 | 12.17 | 5.46 | 12.00 | 0.26 | 0.99 | 1.10 | |
| 2023-06 | 最小值 | 0.41 | 0.32 | 0.08 | 0.02 | 7.82 | 0.19 | 0.48 | 1.52 |
| 最大值 | 123.19 | 93.59 | 19.37 | 10.24 | 18.58 | 2.07 | 0.98 | 2.00 | |
| 平均值 | 78.41 | 58.60 | 12.78 | 7.03 | 9.40 | 0.41 | 0.88 | 1.83 | |
表5 研究区水样REEs浓度及分异特征参数
Table 5 Rare earth elements (REEs) content and fractionation indices of water samples in the study area
| 采样时间 | 统计量 | 离子浓度/(μg·L-1) | LREE/HREE | δCe | δEu | (Yb/Nd)UCC | |||
|---|---|---|---|---|---|---|---|---|---|
| ΣREE | LREE | MREE | HREE | ||||||
| 2022-03 | 最小值 | 12.11 | 9.12 | 1.98 | 1.00 | 9.08 | 0.16 | 0.96 | 0.83 |
| 最大值 | 191.23 | 149.08 | 29.08 | 13.07 | 14.41 | 0.33 | 1.02 | 1.37 | |
| 平均值 | 82.60 | 64.97 | 12.17 | 5.46 | 12.00 | 0.26 | 0.99 | 1.10 | |
| 2023-06 | 最小值 | 0.41 | 0.32 | 0.08 | 0.02 | 7.82 | 0.19 | 0.48 | 1.52 |
| 最大值 | 123.19 | 93.59 | 19.37 | 10.24 | 18.58 | 2.07 | 0.98 | 2.00 | |
| 平均值 | 78.41 | 58.60 | 12.78 | 7.03 | 9.40 | 0.41 | 0.88 | 1.83 | |

图3 研究区水样经上陆壳(UCC)标准化REEs配分模式和REEs形态模拟结果 a,c—第一批;b,d—第二批。
Fig.3 UCC-normalized REE patterns for water samples and results of REE speciation calculations ((a) and (c): the first campaign; (b) and (d): the second campaign)
| 点位 | 深度/cm | ΣREE | δCe | δEu | 点位 | 深度/cm | ΣREE | δCe | δEu | 点位 | 深度/cm | ΣREE | δCe | δEu |
|---|---|---|---|---|---|---|---|---|---|---|---|---|---|---|
| K1 | 0 | 736.95 | 0.63 | 1.01 | K3 | 0 | 662.83 | 0.37 | 0.98 | XS1 | 50 | 275.77 | 0.95 | 0.56 |
| 30 | 203.72 | 0.88 | 0.95 | K4 | 20 | 492.68 | 0.54 | 0.97 | 100 | 209.45 | 0.96 | 0.47 | ||
| 60 | 251.56 | 0.86 | 1.00 | 40 | 436.31 | 0.49 | 0.97 | XS2 | 50 | 184.79 | 0.97 | 0.51 | ||
| 80 | 266.64 | 0.84 | 1.02 | 60 | 379.76 | 0.73 | 0.96 | 100 | 218.37 | 0.96 | 0.51 | |||
| 90 | 266.21 | 0.92 | 1.01 | 70 | 404.88 | 0.66 | 0.97 | 150 | 298.47 | 0.95 | 0.57 | |||
| K2 | 10 | 489.10 | 0.33 | 0.95 | K5 | 0 | 369.78 | 0.41 | 0.98 | XS3 | 50 | 228.78 | 0.99 | 0.94 |
| 30 | 220.55 | 0.71 | 0.98 | K6 | 0 | 1 259.18 | 0.47 | 1.02 | 75 | 234.26 | 0.79 | 0.97 | ||
| 60 | 242.61 | 0.76 | 0.98 | 10 | 1 026.56 | 0.39 | 0.99 | 100 | 219.54 | 0.72 | 0.95 | |||
| 80 | 170.58 | 0.82 | 0.96 | 20 | 661.43 | 0.43 | 1.01 | 200 | 267.76 | 0.95 | 0.56 | |||
| 90 | 281.86 | 0.85 | 0.98 | 50 | 215.14 | 0.44 | 1.03 | XS4 | 50 | 449.99 | 0.52 | 0.91 | ||
| 100 | 323.47 | 0.50 | 0.93 |
表6
Table 6 δCe and δEu values at different depths at each sampling point
| 点位 | 深度/cm | ΣREE | δCe | δEu | 点位 | 深度/cm | ΣREE | δCe | δEu | 点位 | 深度/cm | ΣREE | δCe | δEu |
|---|---|---|---|---|---|---|---|---|---|---|---|---|---|---|
| K1 | 0 | 736.95 | 0.63 | 1.01 | K3 | 0 | 662.83 | 0.37 | 0.98 | XS1 | 50 | 275.77 | 0.95 | 0.56 |
| 30 | 203.72 | 0.88 | 0.95 | K4 | 20 | 492.68 | 0.54 | 0.97 | 100 | 209.45 | 0.96 | 0.47 | ||
| 60 | 251.56 | 0.86 | 1.00 | 40 | 436.31 | 0.49 | 0.97 | XS2 | 50 | 184.79 | 0.97 | 0.51 | ||
| 80 | 266.64 | 0.84 | 1.02 | 60 | 379.76 | 0.73 | 0.96 | 100 | 218.37 | 0.96 | 0.51 | |||
| 90 | 266.21 | 0.92 | 1.01 | 70 | 404.88 | 0.66 | 0.97 | 150 | 298.47 | 0.95 | 0.57 | |||
| K2 | 10 | 489.10 | 0.33 | 0.95 | K5 | 0 | 369.78 | 0.41 | 0.98 | XS3 | 50 | 228.78 | 0.99 | 0.94 |
| 30 | 220.55 | 0.71 | 0.98 | K6 | 0 | 1 259.18 | 0.47 | 1.02 | 75 | 234.26 | 0.79 | 0.97 | ||
| 60 | 242.61 | 0.76 | 0.98 | 10 | 1 026.56 | 0.39 | 0.99 | 100 | 219.54 | 0.72 | 0.95 | |||
| 80 | 170.58 | 0.82 | 0.96 | 20 | 661.43 | 0.43 | 1.01 | 200 | 267.76 | 0.95 | 0.56 | |||
| 90 | 281.86 | 0.85 | 0.98 | 50 | 215.14 | 0.44 | 1.03 | XS4 | 50 | 449.99 | 0.52 | 0.91 | ||
| 100 | 323.47 | 0.50 | 0.93 |
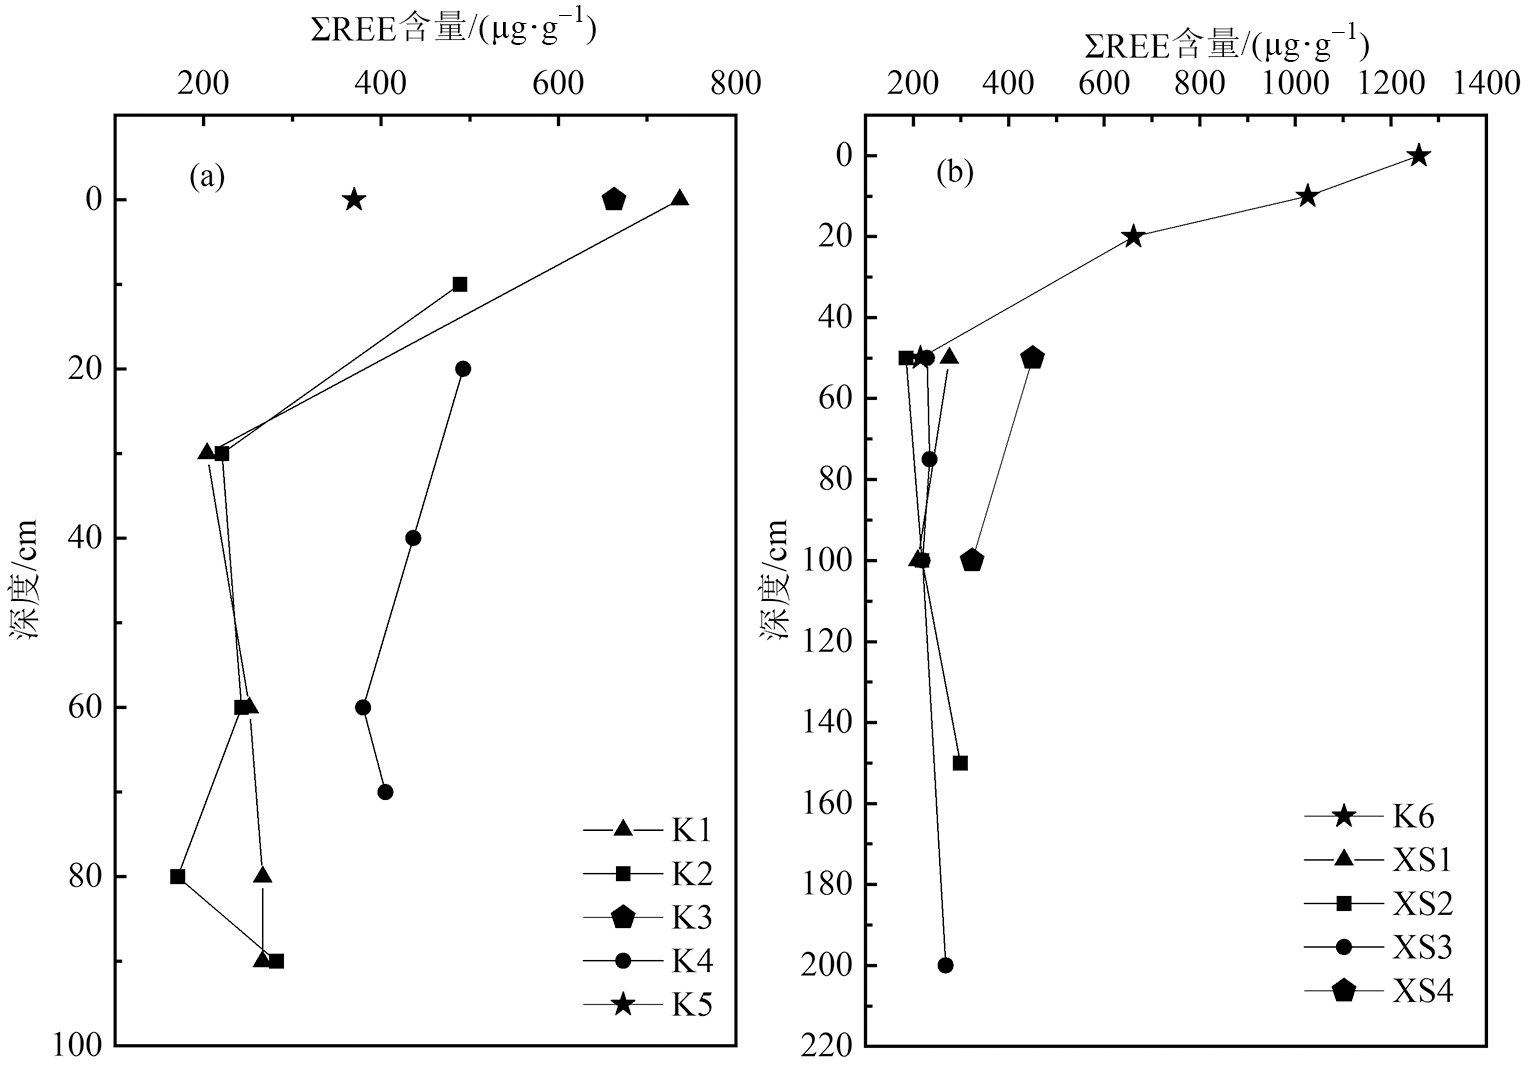
图4 沉积物不同深度REEs含量的变化 a—尾矿库下游;b—尾矿库内。
Fig.4 Variation of REE content in sediments at different depths (a-downstream of the tailings pond, b-in the tailings pond).

图5 研究区沉积物经上陆壳(UCC)标准化REEs配分模式
Fig.5 UCC-normalized REE patterns for sediments in the study area a—K1;b—K2;c—K3~K5;d—K6;e—XS1~XS2;f—XS3~XS4。 ((a) K1; (b) K2; (c) K3~K5; (d) K6; (e) XS1~XS2; (f) XS3~XS4)
| 位置 | 统计量 | 元素含量/(μg·g-1) | ||||||
|---|---|---|---|---|---|---|---|---|
| Mn | Fe | Cr | Ni | Cu | Cd | Pb | ||
| 尾矿库下游 | 最大值 | 177 000.00 | 174 000.00 | 169.00 | 283.00 | 96.50 | 20.50 | 75.10 |
| 最小值 | 450.00 | 26 300.00 | 37.80 | 32.40 | 24.60 | 0.35 | 23.10 | |
| 平均值 | 36 156.19 | 64 331.25 | 113.06 | 100.46 | 51.57 | 5.35 | 40.46 | |
| 尾矿库内 | 最大值 | 14 900.00 | 258 000.00 | 149.00 | 64.50 | 93.60 | 131.00 | 134.00 |
| 最小值 | 447.00 | 18 700.00 | 22.90 | 9.19 | 13.50 | 0.39 | 18.60 | |
| 平均值 | 4 272.33 | 76 646.67 | 71.78 | 41.13 | 37.90 | 13.32 | 81.23 | |
| 江西省表层沉积物背景值 | — | — | 45.90 | 18.90 | 20.30 | 0.11 | 32.30 | |
表7 研究区沉积物部分重金属含量统计
Table 7 Statistics of heavy metal content in sediments in the study area
| 位置 | 统计量 | 元素含量/(μg·g-1) | ||||||
|---|---|---|---|---|---|---|---|---|
| Mn | Fe | Cr | Ni | Cu | Cd | Pb | ||
| 尾矿库下游 | 最大值 | 177 000.00 | 174 000.00 | 169.00 | 283.00 | 96.50 | 20.50 | 75.10 |
| 最小值 | 450.00 | 26 300.00 | 37.80 | 32.40 | 24.60 | 0.35 | 23.10 | |
| 平均值 | 36 156.19 | 64 331.25 | 113.06 | 100.46 | 51.57 | 5.35 | 40.46 | |
| 尾矿库内 | 最大值 | 14 900.00 | 258 000.00 | 149.00 | 64.50 | 93.60 | 131.00 | 134.00 |
| 最小值 | 447.00 | 18 700.00 | 22.90 | 9.19 | 13.50 | 0.39 | 18.60 | |
| 平均值 | 4 272.33 | 76 646.67 | 71.78 | 41.13 | 37.90 | 13.32 | 81.23 | |
| 江西省表层沉积物背景值 | — | — | 45.90 | 18.90 | 20.30 | 0.11 | 32.30 | |

图6 研究区水样Gibbs图
Fig.6 Gibbs diagram of water samples in the study area
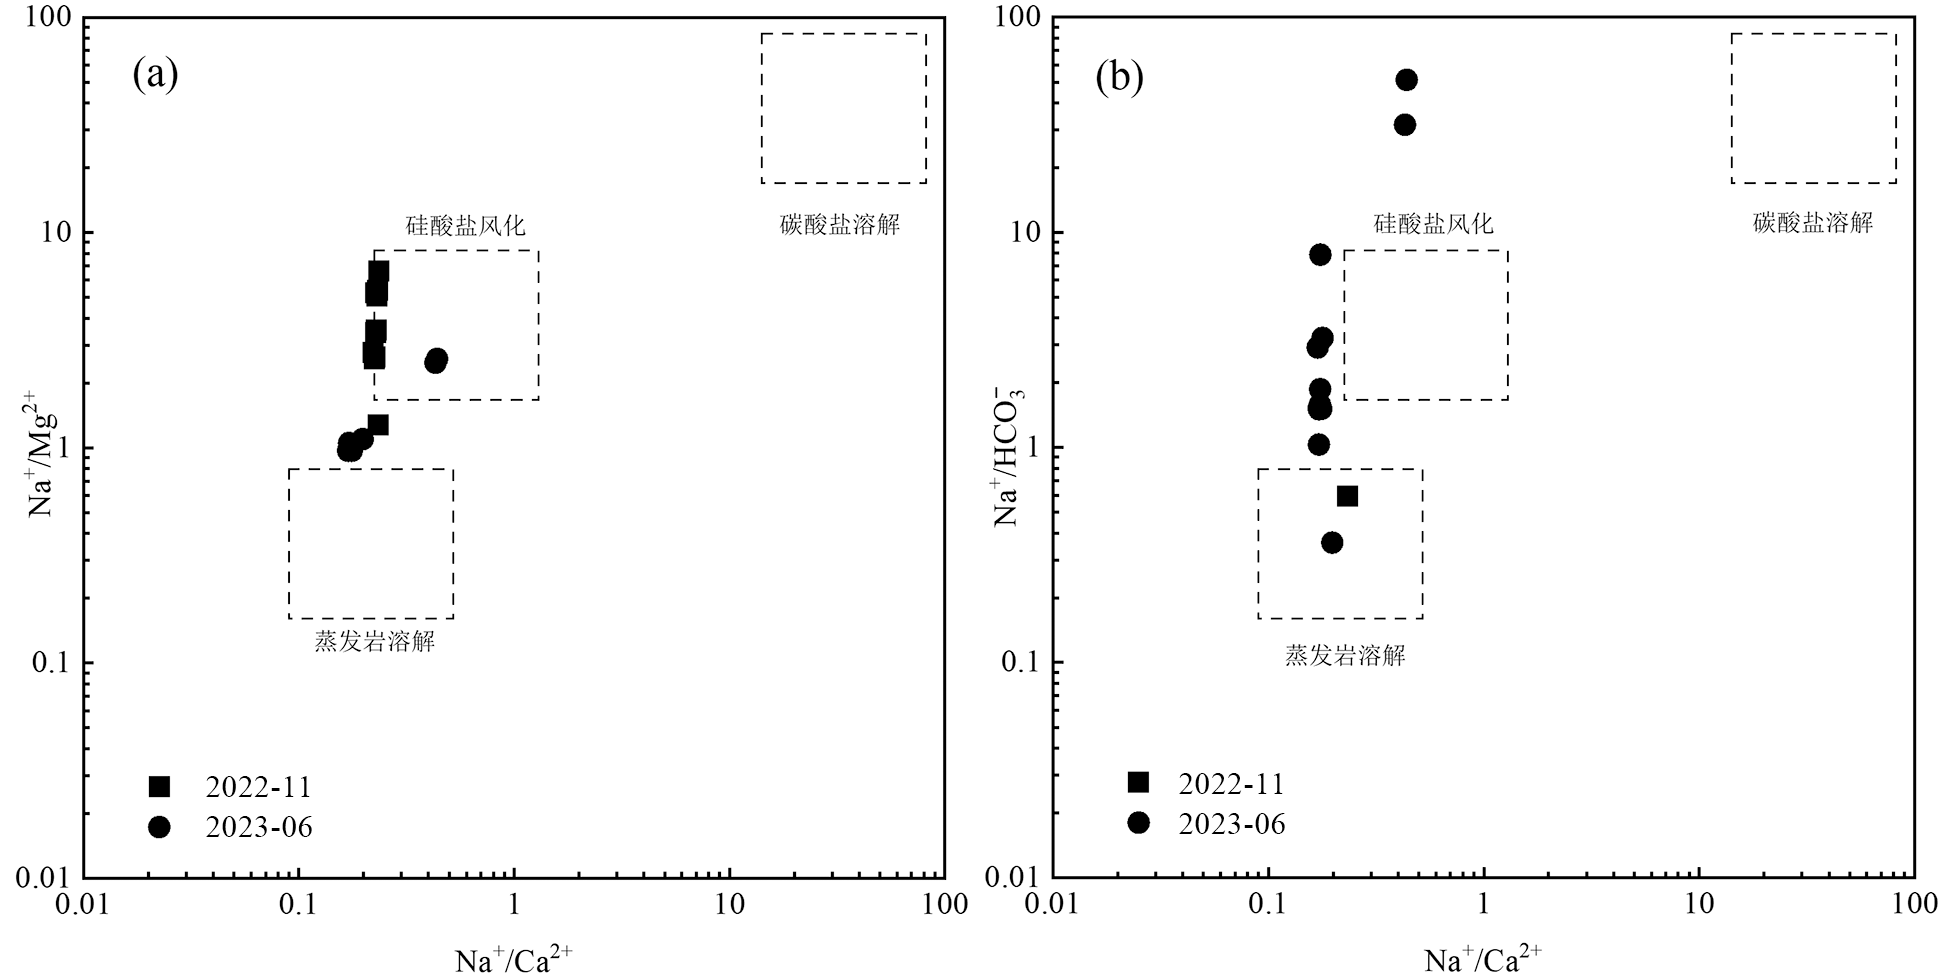
图7 Na+/Ca2+与Na+/Mg2+(a)和Na+/HCO3- (b)摩尔比的关系图
Fig.7 The molar ratio relationship between Na+/Ca2+ and Na+/Mg2+(a), and Na+/HCO3- (b)
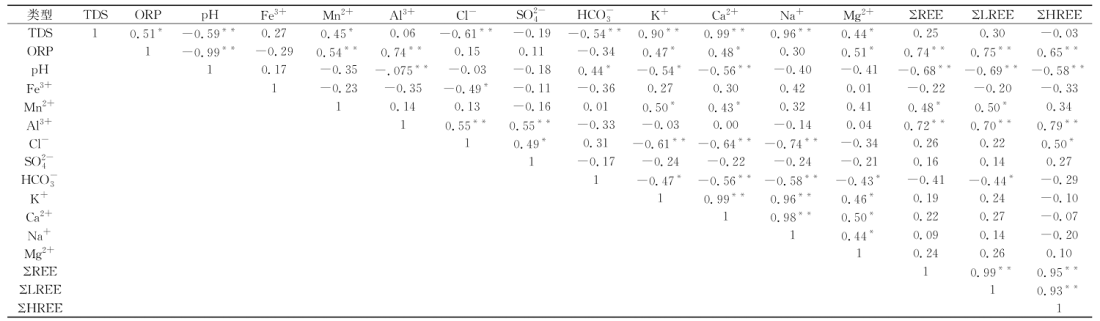 |
表8 研究区水化学成分相关性矩阵
Table 8 Correlation matrix of water chemical compositions in study area
| |
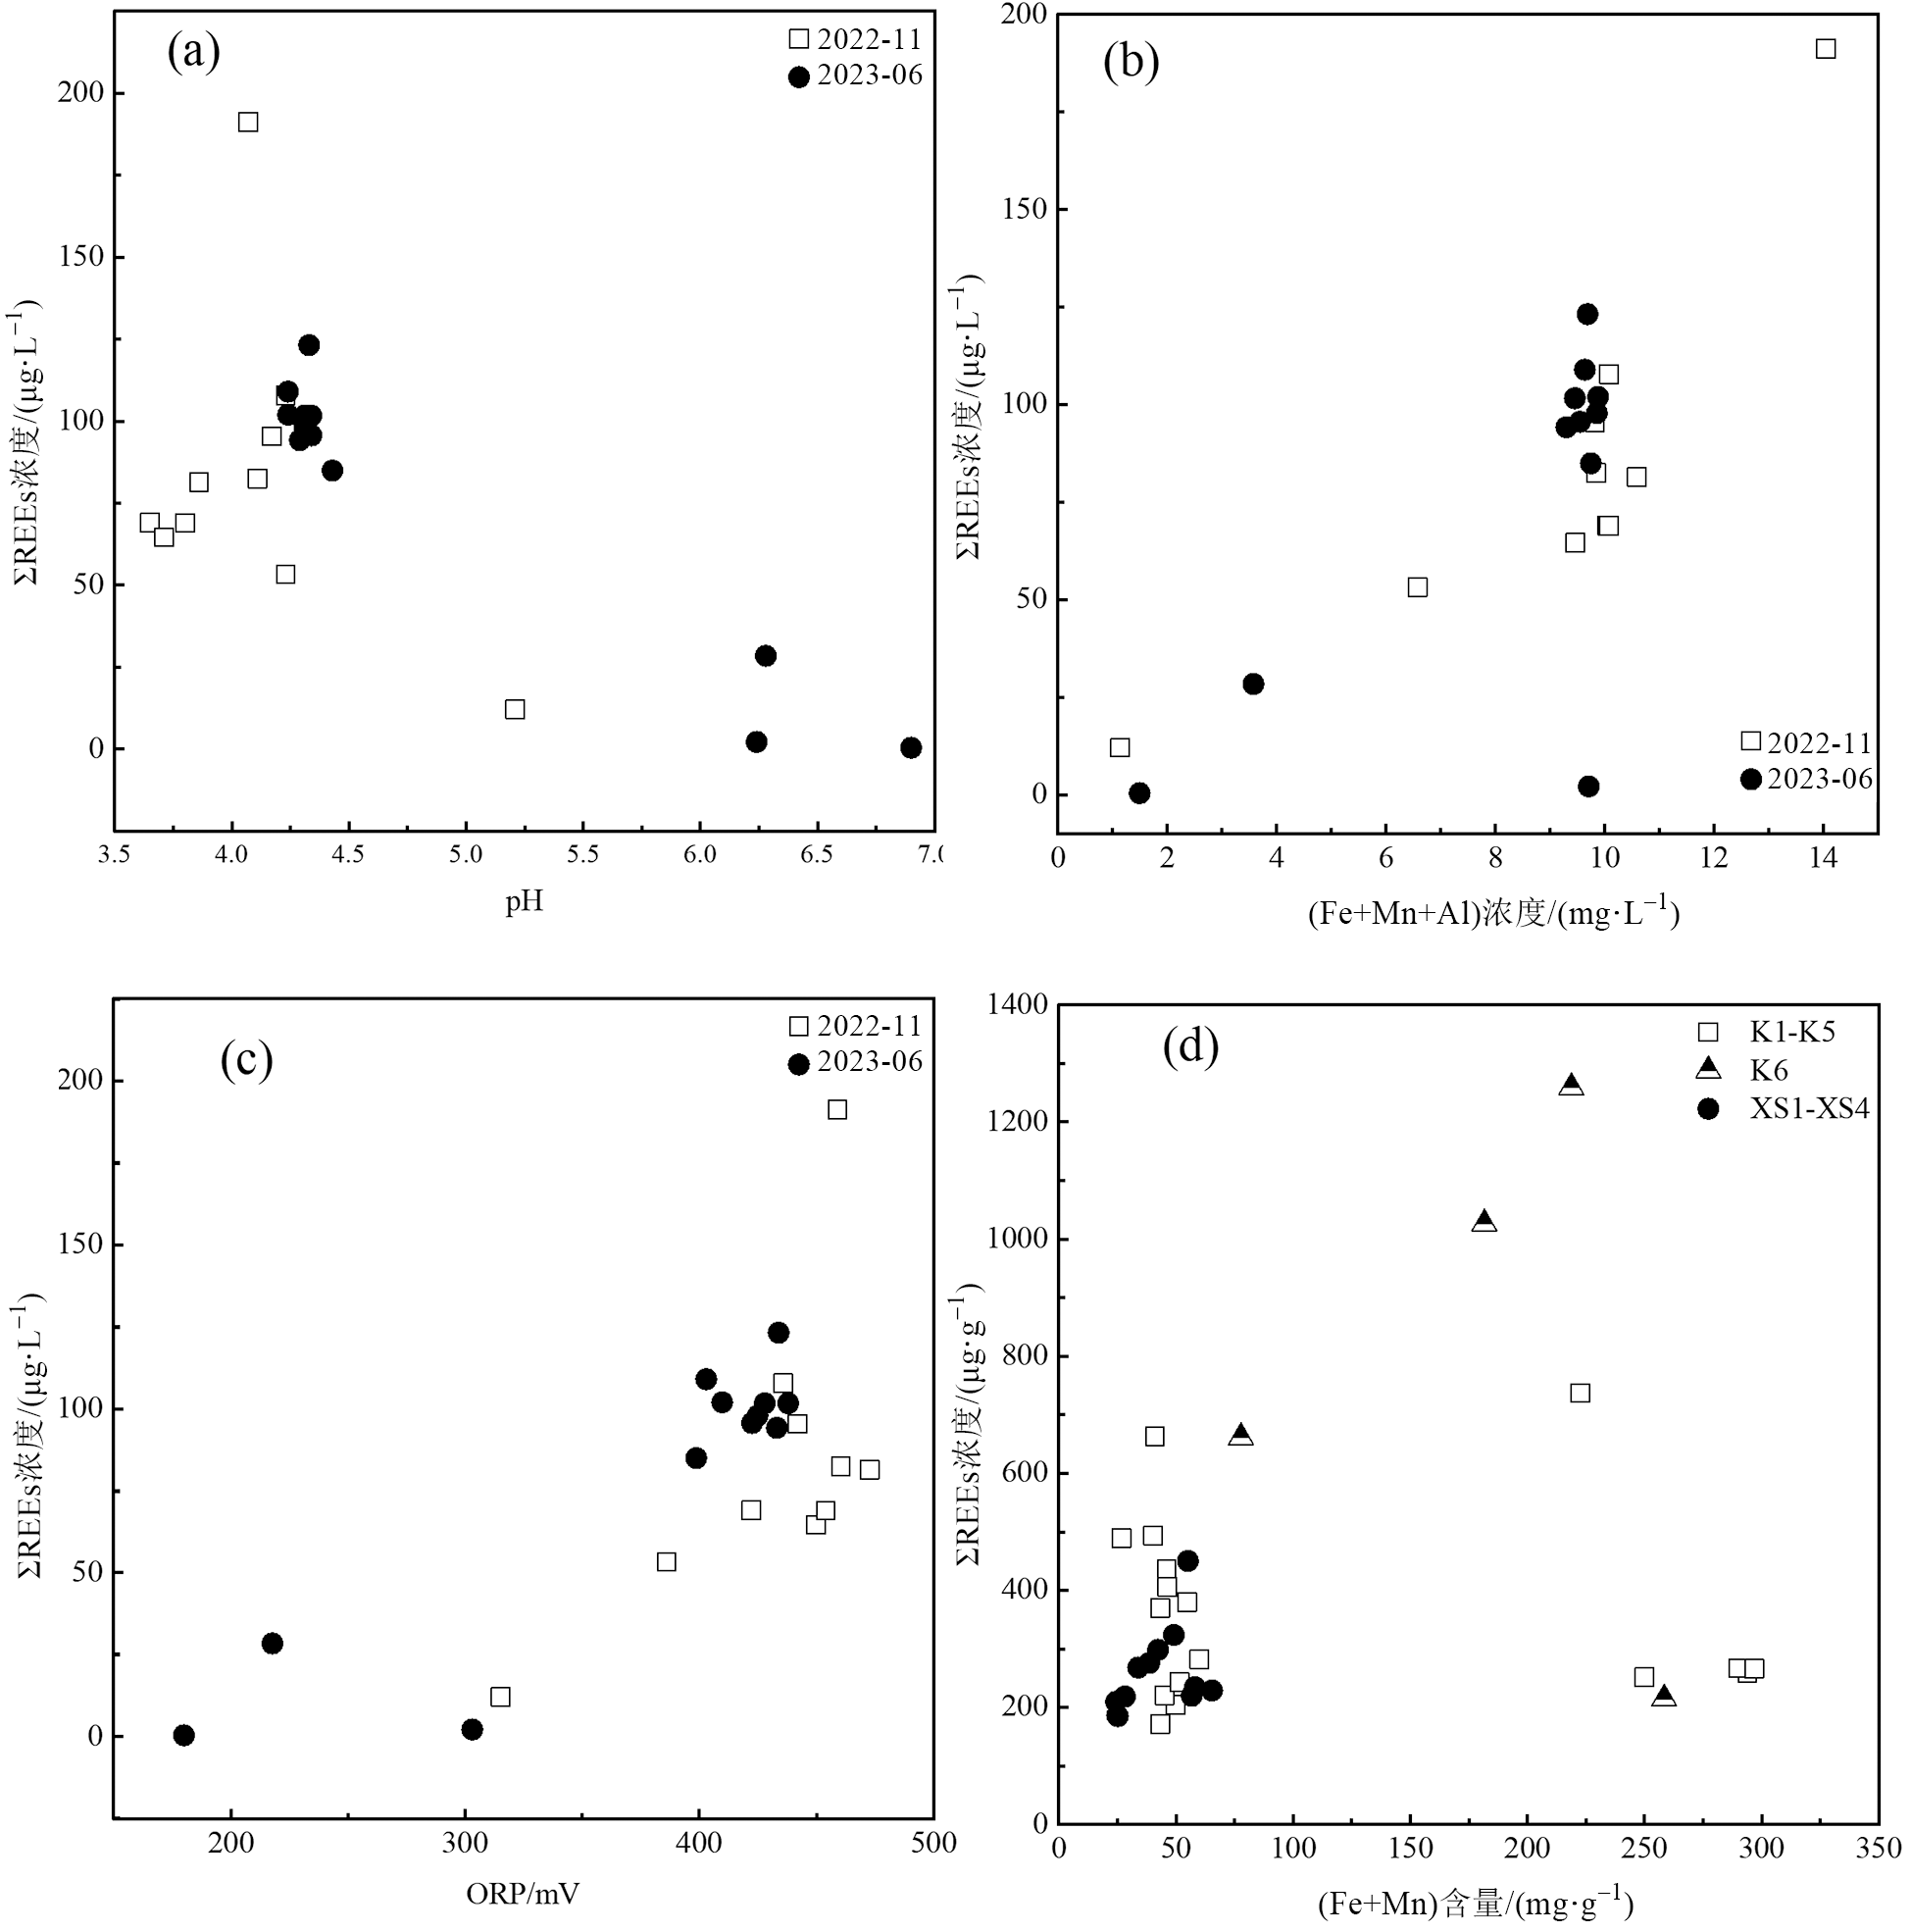
图8 研究区水体与REEs浓度与pH(a)、Fe+Mn+Al(b)、ORP(c)的关系,沉积物中REEs含量与Fe+Mn(d)之间的关系
Fig.8 The relationship between REE concentrations and pH (a), Fe + Mn + Al (b), and ORP (c) in water samples, and the relationship between REE concentrations and Fe + Mn in sediments (d)
| 点位 | 统计量 | 酸浸 | 消解 | 浸出率/% | δCe | δEu | 点位 | 统计量 | 酸浸 | 消解 | 浸出率/% | δCe | δEu |
|---|---|---|---|---|---|---|---|---|---|---|---|---|---|
| K2 | 最大值 | 118.4 | 281.9 | 54.7 | 1.0 | 1.0 | XS2 | 最大值 | 270.6 | 298.5 | 90.7 | 1.0 | 0.6 |
| 最小值 | 92.1 | 170.6 | 29.1 | 0.3 | 0.9 | 最小值 | 131.7 | 184.8 | 67.3 | 0.6 | 0.5 | ||
| 平均值 | 99.9 | 228.9 | 45.2 | 0.7 | 0.9 | 平均值 | 183.1 | 233.9 | 76.2 | 0.9 | 0.5 | ||
| K6 | 最大值 | 765.3 | 1 259.2 | 68.4 | 0.4 | 1.1 | XS3 | 最大值 | 213.7 | 267.8 | 79.8 | 1.8 | 0.9 |
| 最小值 | 111.6 | 215.1 | 51.9 | 0.3 | 1.0 | 最小值 | 24.4 | 219.5 | 10.7 | 0.5 | 0.6 | ||
| 平均值 | 496.9 | 790.6 | 60.7 | 0.4 | 1.0 | 平均值 | 83.0 | 237.6 | 33.1 | 1.0 | 0.8 | ||
| XS1 | 最大值 | 98.6 | 275.8 | 47.1 | 1.2 | 0.5 | XS4 | 最大值 | 116.2 | 450.0 | 35.9 | 0.1 | 0.9 |
| 最小值 | 98.6 | 209.5 | 35.7 | 0.8 | 0.5 | 最小值 | 97.3 | 323.5 | 21.6 | 0.1 | 0.9 | ||
| 平均值 | 98.6 | 242.6 | 41.4 | 1.0 | 0.5 | 平均值 | 106.7 | 386.7 | 28.8 | 0.1 | 0.9 |
表9 沉积物硫酸酸浸出液中REEs含量和Ce、Eu异常值
Table 9 Concentrations of REEs and Ce and Eu anomalies in sediment sulfuric acid leaching solutions
| 点位 | 统计量 | 酸浸 | 消解 | 浸出率/% | δCe | δEu | 点位 | 统计量 | 酸浸 | 消解 | 浸出率/% | δCe | δEu |
|---|---|---|---|---|---|---|---|---|---|---|---|---|---|
| K2 | 最大值 | 118.4 | 281.9 | 54.7 | 1.0 | 1.0 | XS2 | 最大值 | 270.6 | 298.5 | 90.7 | 1.0 | 0.6 |
| 最小值 | 92.1 | 170.6 | 29.1 | 0.3 | 0.9 | 最小值 | 131.7 | 184.8 | 67.3 | 0.6 | 0.5 | ||
| 平均值 | 99.9 | 228.9 | 45.2 | 0.7 | 0.9 | 平均值 | 183.1 | 233.9 | 76.2 | 0.9 | 0.5 | ||
| K6 | 最大值 | 765.3 | 1 259.2 | 68.4 | 0.4 | 1.1 | XS3 | 最大值 | 213.7 | 267.8 | 79.8 | 1.8 | 0.9 |
| 最小值 | 111.6 | 215.1 | 51.9 | 0.3 | 1.0 | 最小值 | 24.4 | 219.5 | 10.7 | 0.5 | 0.6 | ||
| 平均值 | 496.9 | 790.6 | 60.7 | 0.4 | 1.0 | 平均值 | 83.0 | 237.6 | 33.1 | 1.0 | 0.8 | ||
| XS1 | 最大值 | 98.6 | 275.8 | 47.1 | 1.2 | 0.5 | XS4 | 最大值 | 116.2 | 450.0 | 35.9 | 0.1 | 0.9 |
| 最小值 | 98.6 | 209.5 | 35.7 | 0.8 | 0.5 | 最小值 | 97.3 | 323.5 | 21.6 | 0.1 | 0.9 | ||
| 平均值 | 98.6 | 242.6 | 41.4 | 1.0 | 0.5 | 平均值 | 106.7 | 386.7 | 28.8 | 0.1 | 0.9 |

图9 沉积物硫酸浸出液REEs上陆壳(UCC)标准化配分模式
Fig.9 UCC-normalized REE patterns for sediment sulfuric acid leaching solutions

图10 水-土系统REEs迁移简图
Fig.10 A schematic diagram of REE migration in a water-soil system
| [1] | JOHNSON D B, HALLBERG K B. Acid mine drainage remediation options: a review[J]. Science of the Total Environment, 2005, 338(1/2): 3-14. |
| [2] | GIMENO SERRANO M J, AUQUÉ SANZ L F, NORDSTROM D K. REE speciation in low-temperature acidic waters and the competitive effects of aluminum[J]. Chemical Geology, 2000, 165(3/4): 167-180. |
| [3] | MARMOLEJO-RODRÍGUEZ A J, SÁNCHEZ-MARTÍNEZ M A, MAGALLANES-ORDÓÑEZ V R, et al. Patterns of rare earth elements in sediments as tracers in a fluvial system influenced by a gold mine, el Triunfo, BCS, Mexico[J]. Procedia Earth and Planetary Science, 2013, 7: 558-561. |
| [4] | WORRALL F, PEARSON D G. Water-rock interaction in an acidic mine discharge as indicated by rare earth elementpatterns[J]. Geochimica et Cosmochimica Acta, 2001, 65(18): 3027-3040. |
| [5] | BARRETT S D, DHESI S S. The structure of rare-earth metal surfaces[M]. London: Imperial College Press, 2001. |
| [6] | VONCKEN J H L. The rare earth elements: an introduction[M]. New York: Springer Briefs in Earth, 2016. |
| [7] | TANG J W, JOHANNESSON K H. Controls on the geochemistry of rare earth elements along a groundwater flow path in the Carrizo Sand aquifer, Texas, USA[J]. Chemical Geology, 2006, 225(1/2): 156-171. |
| [8] | WALLRICH I L R, STEWART B W, CAPO R C, et al. Neodymium isotopes track sources of rare earth elements in acidic mine waters[J]. Geochimica et Cosmochimica Acta, 2020, 269: 465-483. |
| [9] | PÉREZ-LÓPEZ R, DELGADO J, NIETO J M, et al. Rare earth element geochemistry of sulphide weathering in the São domingos mine area (Iberian pyrite belt): a proxy for fluid-rock interaction and ancient mining pollution[J]. Chemical Geology, 2010, 276(1/2): 29-40. |
| [10] |
DELGADO J, PÉREZ-LÓPEZ R, GALVÁN L, et al. Enrichment of rare earth elements as environmental tracers of contamination by acid mine drainage in salt marshes: a new perspective[J]. Marine Pollution Bulletin, 2012, 64(9): 1799-1808.
DOI PMID |
| [11] | 何阳阳, 温春齐, 刘显凡. 西藏多不杂铜矿床脉石矿物稀土元素地球化学示踪[J]. 有色金属工程, 2018, 8(3): 115-119. |
| [12] | 曾红, 柴凤梅, 周刚, 等. 东天山雅满苏铁矿床稀土元素地球化学示踪[J]. 新疆地质, 2014, 32(4): 475-480. |
| [13] | STEWART B W, CAPO R C, HEDIN B C, et al. Rare earth element resources in coal mine drainage and treatment precipitates in the Appalachian Basin, USA[J]. International Journal of Coal Geology, 2017, 169: 28-39. |
| [14] | WORRALL F, PEARSON D G. The development of acidic groundwaters in coal-bearing strata: part I. rare earth element fingerprinting[J]. Applied Geochemistry, 2001, 16(13): 1465-1480. |
| [15] | GAMMONS C H, WOOD S A, PEDROZO F, et al. Hydrogeochemistry and rare earth element behavior in a volcanically acidified watershed in Patagonia, Argentina[J]. Chemical Geology, 2005, 222(3/4): 249-267. |
| [16] | ZHAO F H, CONG Z Y, SUN H F, et al. The geochemistry of rare earth elements (REE) in acid mine drainage from the Sitai coal mine, Shanxi Province, North China[J]. International Journal of Coal Geology, 2007, 70(1/2/3): 184-192. |
| [17] | MEDAS D, CIDU R, DE GIUDICI G, et al. Geochemistry of rare earth elements in water and solid materials at abandoned mines in SW Sardinia (Italy)[J]. Journal of Geochemical Exploration, 2013, 133: 149-159. |
| [18] | GAMMONS C H, WOOD S A, JONAS J P, et al. Geochemistry of the rare-earth elements and uranium in the acidic Berkeley Pit lake, Butte, Montana[J]. Chemical Geology, 2003, 198(3/4): 269-288. |
| [19] | MIGASZEWSKI Z M, GAŁUSZKA A, MIGASZEWSKI A. The study of rare earth elements in farmer’s well waters of the Podwiśniówka acid mine drainage area (south-central Poland)[J]. Environmental Monitoring and Assessment, 2014, 186(3): 1609-1622. |
| [20] | 巫建华, 劳玉军, 谢国发, 等. 江西相山铀矿田火山岩系地层学、年代学特征及地质意义[J]. 中国地质, 2017, 44(5): 974-992. |
| [21] | 张万良, 郭福生, 李嘉, 等. 相山铀矿田矿体分布规律研究新进展[J]. 东华理工大学学报(自然科学版), 2022, 45(4): 311-318. |
| [22] | 周敏. 钍在铀水冶过程中的迁移行为研究[D]. 抚州: 东华理工大学, 2013. |
| [23] | 张展适, 李满根, 杨亚新, 等. 赣、粤、湘地区部分硬岩型铀矿山辐射环境污染及治理现状[J]. 铀矿冶, 2007, 26(4): 191-196. |
| [24] | MCLENNAN S M. Relationships between the trace element composition of sedimentary rocks and upper continental crust[J]. Geochemistry, Geophysics, Geosystems, 2001, 2(4): 2000GC000109. |
| [25] | KLUNGNESS G D, BYRNE R H. Comparative hydrolysis behavior of the rare earths and yttrium: the influence of temperature and ionic strength[J]. Polyhedron, 2000, 19(1): 99-107. |
| [26] | LEE J H, BYRNE R H. Examination of comparative rare earth element complexation behavior using linear free-energy relationships[J]. Geochimica et Cosmochimica Acta, 1992, 56(3): 1127-1137. |
| [27] | LUO Y R, BYRNE R H. Carbonate complexation of yttrium and the rare earth elements in natural waters[J]. Geochimica et Cosmochimica Acta, 2004, 68(4): 691-699. |
| [28] | SCHIJF J, BYRNE R H. Determination of SO4 β1 for yttrium and the rare earth elements at I=0.66 m and t=25 ℃: implications for YREE solution speciation in sulfate-rich waters[J]. Geochimica et Cosmochimica Acta, 2004, 68(13): 2825-2837. |
| [29] | MIGDISOV A A, WILLIAMS-JONES A E, WAGNER T. An experimental study of the solubility and speciation of the rare earth elements (III) in fluoride- and chloride-bearing aqueous solutions at temperatures up to 300 ℃[J]. Geochimica et Cosmochimica Acta, 2009, 73(23): 7087-7109. |
| [30] | MULLER G. Index of geoaccumulation in sediments of the Rhine River[J]. GeoJournal, 1969, 2: 108-118. |
| [31] | 中国环境监测总站. 中国土壤元素背景值[M]. 北京: 中国环境科学出版社, 1990. |
| [32] |
张军伟, 刘顺, 文雯, 等. 矿山酸性废水治理与综合利用研究进展[J]. 资源环境与工程, 2023, 37(6): 734-740.
DOI |
| [33] | ZHOU H Y, GREIG A, TANG J, et al. Rare earth element patterns in a Chinese stalagmite controlled by sources and scavenging from karst groundwater[J]. Geochimica et Cosmochimica Acta, 2012, 83: 1-18. |
| [34] | OGAWA Y, ISHIYAMA D, SHIKAZONO N, et al. Fractionation of rare earth elements (REEs) and actinides (U and Th) originating from acid thermal water during artificial and natural neutralization processes of surface waters[J]. Geochimica et Cosmochimica Acta, 2019, 249: 247-262. |
| [35] | 林卓玲, 黄光庆. 土壤稀土元素的迁移-富集机制及其生态效应[J]. 地球环境学报, 2023, 14(5): 521-538. |
| [36] |
王玉洁, 刘蓓蓓, 万全, 等. 稀土元素在土壤中的释放与迁移研究进展[J]. 生态环境学报, 2021, 30(3): 644-654.
DOI |
| [37] | ÅSTRÖM M. Abundance and fractionation patterns of rare earth elements in streams affected by acid sulphate soils[J]. Chemical Geology, 2001, 175(3/4): 249-258. |
| [38] | MIGASZEWSKI Z M, GAŁUSZKA A, DOŁĘGOWSKA S. Rare earth and trace element signatures for assessing an impact of rock mining and processing on the environment: Wiśniówka case study, South-central Poland[J]. Environmental Science and Pollution Research, 2016, 23(24): 24943-24959. |
| [39] | 蓝先洪, 密蓓蓓, 陈晓辉, 等. 北黄海中部晚第四纪沉积物来源的稀土元素示踪[J]. 中国稀土学报, 2015, 33(2): 241-252. |
| [40] | 杨守业, 李从先. REE示踪沉积物物源研究进展[J]. 地球科学进展, 1999, 14(2): 63-66. |
| [41] | CHEVIS D A, JOHANNESSON K H, BURDIGE D J, et al. Submarine groundwater discharge of rare earth elements to a tidally-mixed estuary in Southern Rhode Island[J]. Chemical Geology, 2015, 397: 128-142. |
| [42] | XU Z F, HAN G L. Rare earth elements (REE) of dissolved and suspended loads in the Xijiang River, South China[J]. Applied Geochemistry, 2009, 24(9): 1803-1816. |
| [43] | LIU H Y, GUO H M, XING L N, et al. Geochemical behaviors of rare earth elements in groundwater along a flow path in the North China Plain[J]. Journal of Asian Earth Sciences, 2016, 117: 33-51. |
| [44] | BAU M. Scavenging of dissolved yttrium and rare earths by precipitating iron oxyhydroxide: experimental evidence for Ce oxidation, Y-Ho fractionation, and lanthanide tetrad effect[J]. Geochimica et Cosmochimica Acta, 1999, 63(1): 67-77. |
| [45] | LAVEUF C, CORNU S. A review on the potentiality of rare earth elements to trace pedogenetic processes[J]. Geoderma, 2009, 154(1/2): 1-12. |
| [46] | BROOKINS D. Aqueous geochemistry of rare earth elements[J]. Reviews in Mineralogy and Geochemistry, 1989, 21: 201-225. |
| [1] | 董姝, 刘海燕, 张一帆, 王振, 郭华明, 孙占学, 周仲魁. 相山铀矿尾矿区植物—根际土壤稀土元素和铀、钍生物富集特征[J]. 地学前缘, 2024, 31(6): 474-489. |
| [2] | 王振, 郭华明, 刘海燕, 邢世平. 贵德盆地高氟地下水稀土元素特征及其指示意义[J]. 地学前缘, 2023, 30(3): 505-514. |
| [3] | 罗欢, 邵德勇, 孟康, 张瑜, 宋辉, 闫建萍, 张同伟. 鄂西宜昌地区寒武系页岩过剩钡成因及其对有机质富集的指示[J]. 地学前缘, 2023, 30(3): 66-82. |
| [4] | 徐林刚, 付雪瑞, 叶会寿, 郑伟, 陈勃, 方正龙. 南秦岭地区下寒武统黑色页岩赋存的千家坪大型钒矿地球化学特征及成矿环境[J]. 地学前缘, 2022, 29(1): 160-175. |
| [5] | 梁晓亮, 谭伟, 马灵涯, 朱建喜, 何宏平. 离子吸附型稀土矿床形成的矿物表/界面反应机制[J]. 地学前缘, 2022, 29(1): 29-41. |
| [6] | 易泽邦, 付伟, 赵芹, 许成, 陆济璞. 花岗岩风化壳中稀土纳米微粒的提取、表征及赋存状态研究[J]. 地学前缘, 2022, 29(1): 42-53. |
| [7] | 任江波, 邓义楠, 赖佩欣, 何高文, 王汾连, 姚会强, 邓希光, 刘永刚. 太平洋调查区多金属结核的地球化学特征和成因[J]. 地学前缘, 2021, 28(2): 412-425. |
| [8] | 王旭影, 姜在兴. 苏北盆地古近系阜三段物源特征及其形成的构造背景分析[J]. 地学前缘, 2021, 28(2): 376-390. |
| [9] | 洪瑾,甘成势,刘洁. 基于机器学习的洋岛玄武岩主量元素预测稀土元素[J]. 地学前缘, 2019, 26(4): 45-54. |
| [10] | 柳青青,迟清华,王学求,周建,刘汉粮,刘东盛,高艳芳,翟大兴. 中国东部大陆尺度地球化学走廊带碳酸盐岩稀土元素分布特征与影响因素[J]. 地学前缘, 2018, 25(4): 99-115. |
| [11] | 于扬,李德先,王登红,黄凡,刘秀丽,田兆雪,邓茂春. 溶解态稀土元素在离子吸附型稀土矿区周边地表水中的分布特征及影响因素[J]. 地学前缘, 2017, 24(5): 172-181. |
| [12] | 任宏,欧阳荷根. 内蒙古拜仁达坝银多金属矿床二氧化碳不混溶成矿作用研究[J]. 地学前缘, 2017, 24(2): 151-158. |
| [13] | 崔晓南,黄文辉,敖卫华,周鸿璞,梁飞. 渭北煤田下峪口矿二叠纪煤中稀土元素地球化学研究[J]. 地学前缘, 2016, 23(3): 90-96. |
| [14] | 郭江峰,姚多喜,陈健,陈萍. 重庆龙潭组煤中稀土元素地球化学及地质成因分析[J]. 地学前缘, 2016, 23(3): 51-58. |
| [15] | 闫德宇,黄文辉,王婷灏,刘贝. 中、下扬子地区下寒武统黑色页岩微量元素富集特征[J]. 地学前缘, 2016, 23(3): 42-50. |
| 阅读次数 | ||||||
|
全文 |
|
|||||
|
摘要 |
|
|||||