地学前缘 ›› 2022, Vol. 29 ›› Issue (3): 129-144.DOI: 10.13745/j.esf.sf.2021.7.24
刘海燕1,2( ), 刘茂涵1,2, 张卫民1,2, 孙占学1,2, 王振1,2, 吴通航1,2, 郭华明3,*()
收稿日期:2021-04-28
修回日期:2021-06-30
出版日期:2022-05-25
发布日期:2022-04-28
通信作者:
郭华明
作者简介:刘海燕(1988—),男,博士,讲师,主要从事水文地球化学研究。E-mail: hy_liu@ecut.edu.com
基金资助:
LIU Haiyan1,2(), LIU Maohan1,2, ZHANG Weimin1,2, SUN Zhanxue1,2, WANG Zhen1,2, WU Tonghang1,2, GUO Huaming3,*()
Received:2021-04-28
Revised:2021-06-30
Online:2022-05-25
Published:2022-04-28
Contact:
GUO Huaming
摘要:
高氟地下水是世界各国研究者广泛关注的重大环境问题。尽管对高氟地下水的化学特征、形成机理和扩散机制等已有不少研究,但其稀土元素(REE)的含量和分异特征以及这些特征能否反映高氟地下水的形成和分布尚不清楚,这在一定程度上限制了REE在高氟地下水中的运用。本研究以地下水氟离子异常严重地区——华北平原为研究区,沿地下水流向采集浅层和深层地下水样,研究分析了水中氟离子和REE的地球化学特征。浓度分析结果表明地下水氟离子浓度介于0.28 mg/L和9.33 mg/L之间,其中55%超出我国饮用水标准规定值1.0 mg/L;PHREEQC计算结果反映地下水中氟以NaF、CaF+、MgF+和自由态F-形式存在,其中自由态F-含量占主导(85.42%99.39%);高氟地下水主要分布于中部冲积湖积平原以及东部冲积海积平原,60%高氟地下水样分布在180 m深度以下;水化学图件分析结果指示浅层高氟地下水的形成主要受蒸发浓缩作用的控制,而深层高氟地下水是水岩相互作用下的矿物溶解和离子竞争吸附共同作用的结果。研究区地下水REE含量处于pmol/L至nmol/L级别,PHREEQC模拟计算结果表明REE主要以碳酸络合物(
中图分类号:
刘海燕, 刘茂涵, 张卫民, 孙占学, 王振, 吴通航, 郭华明. 华北平原高氟地下水中稀土元素分布和分异特征[J]. 地学前缘, 2022, 29(3): 129-144.
LIU Haiyan, LIU Maohan, ZHANG Weimin, SUN Zhanxue, WANG Zhen, WU Tonghang, GUO Huaming. Distribution and fractionation of rare earth elements in high fluoride groundwater from the North China Plain[J]. Earth Science Frontiers, 2022, 29(3): 129-144.
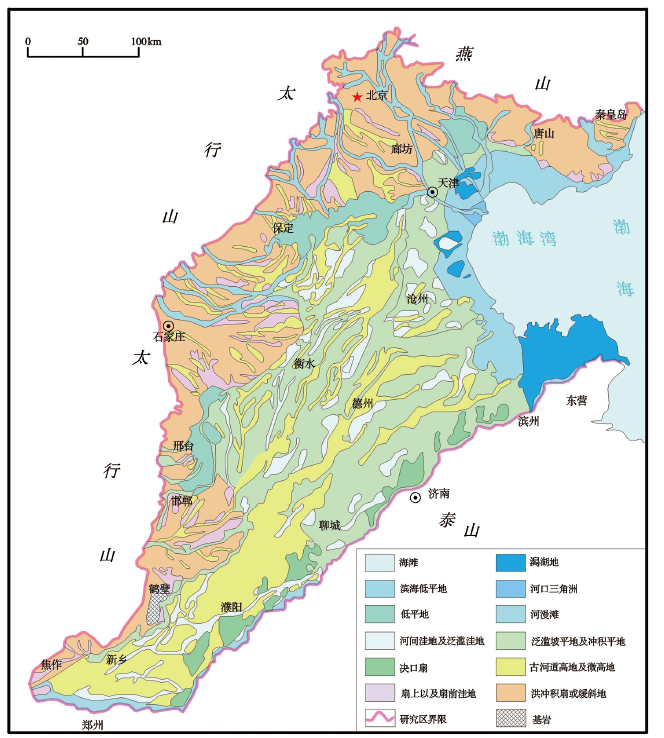
图1 华北平原地理位置及第四纪地貌图
Fig.1 Geographical location of and Quaternary landforms in the North China Plain
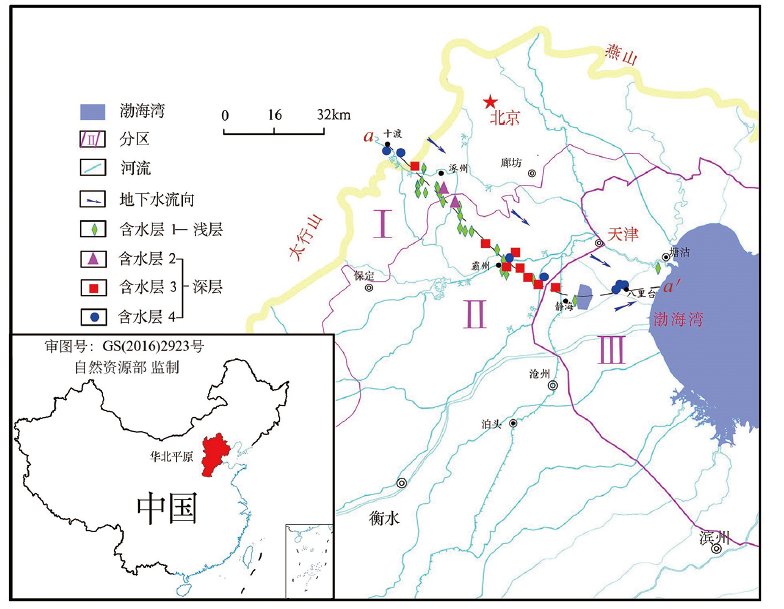
图2 研究区地下水采样点分布图
Fig.2 Distribution of groundwater sampling locations in the study area
| 反应 | 平衡常数 | 参考文献 |
|---|---|---|
| Mg2+ + F- = MgF+ | 1.82 | [ |
| Ca2+ + F- = CaF+ | 0.94 | [ |
| Na+ + F- = NaF | -0.24 | [ |
| Al3+ + F- = AlF2+ | 7.0 | [ |
| Al3+ + 2F- = Al | 12.7 | [ |
| Al3+ + 3F- = AlF3 | 16.8 | [ |
| Al3+ + 4F- = Al | 19.4 | [ |
| Fe3+ + F- = FeF2+ | 6.2 | [ |
| Fe3+ + 2F- = Fe | 10.8 | [ |
| Fe3+ + 3F- = FeF3 | 14 | [ |
表1 WATEQ4F中用于模拟氟阳离子络合的反应式及平衡常数
Table 1 Chemical equations and equilibrium constants used for simulating F--cation complexation reactions in WATEQ4F
| 反应 | 平衡常数 | 参考文献 |
|---|---|---|
| Mg2+ + F- = MgF+ | 1.82 | [ |
| Ca2+ + F- = CaF+ | 0.94 | [ |
| Na+ + F- = NaF | -0.24 | [ |
| Al3+ + F- = AlF2+ | 7.0 | [ |
| Al3+ + 2F- = Al | 12.7 | [ |
| Al3+ + 3F- = AlF3 | 16.8 | [ |
| Al3+ + 4F- = Al | 19.4 | [ |
| Fe3+ + F- = FeF2+ | 6.2 | [ |
| Fe3+ + 2F- = Fe | 10.8 | [ |
| Fe3+ + 3F- = FeF3 | 14 | [ |
 |
表2 加入至PHREEQC数据库WATEQ4F中的稀土元素与阴离子络合反应稳定参数(离子强度IS=0,温度25℃,REE代表稀土元素)
Table 2 Chemical equations and equilibrium constants added to the WATEQ4F database in PHREEQC calculation for REE- anion complexation reactions (ionic strength, 0; temperature, 25℃)
| |
| 区域 | 统计量 | pH | 地下水中各化学组分的指标参数统计值 | ||||||||||||||
|---|---|---|---|---|---|---|---|---|---|---|---|---|---|---|---|---|---|
| TDS | Cl- | F- | K+ | Na+ | Ca2+ | Mg2+ | |||||||||||
| 一区 | 最大值 | 7.97 | 963.00 | 461.16 | 376.63 | 115.85 | 76.08 | 1.33 | 1.86 | 37.49 | 220.71 | 68.14 | |||||
| 最小值 | 7.10 | 222.00 | 204.96 | 3.60 | 0.00 | 11.99 | 0.28 | 0.05 | 3.55 | <检出限 | 24.55 | ||||||
| 平均值 | 7.64 | 391.61 | 302.15 | 48.78 | 44.49 | 43.17 | 0.70 | 1.23 | 11.69 | 91.14 | 31.77 | ||||||
| 标准差 | 0.20 | 155.61 | 65.88 | 83.97 | 37.81 | 17.98 | 0.24 | 0.53 | 7.06 | 43.04 | 9.61 | ||||||
| 变异系数 | 0.03 | 0.40 | 0.22 | 1.72 | 0.85 | 0.42 | 0.34 | 0.43 | 0.60 | 0.47 | 0.30 | ||||||
| 二区 | 最大值 | 8.80 | 4 349.00 | 924.76 | 984.36 | 123.16 | 2 890.38 | 7.07 | 5.66 | 973.42 | 333.18 | 476.73 | |||||
| 最小值 | 7.08 | 274.00 | 31.72 | 4.71 | 0.44 | 17.99 | 0.71 | 0.33 | 28.14 | 3.59 | 1.50 | ||||||
| 平均值 | 7.96 | 1 031.38 | 438.27 | 209.92 | 8.84 | 395.00 | 2.91 | 1.35 | 261.08 | 81.93 | 72.75 | ||||||
| 标准差 | 0.55 | 1 047.07 | 193.14 | 263.43 | 27.14 | 735.41 | 1.81 | 1.26 | 234.02 | 98.49 | 113.32 | ||||||
| 变异系数 | 0.07 | 1.02 | 0.44 | 1.25 | 3.07 | 1.86 | 0.62 | 0.93 | 0.90 | 1.20 | 1.56 | ||||||
| 三区 | 最大值 | 8.51 | 1 179.00 | 405.04 | 463.45 | 5.77 | 242.52 | 9.33 | 2.60 | 429.25 | 13.87 | 14.41 | |||||
| 最小值 | 8.20 | 796.00 | 275.72 | 56.01 | 1.72 | 40.70 | 1.39 | 0.76 | 277.00 | 7.32 | 1.62 | ||||||
| 平均值 | 8.42 | 996.80 | 340.14 | 292.06 | 3.52 | 122.18 | 5.12 | 1.59 | 361.71 | 10.27 | 5.81 | ||||||
| 标准差 | 0.12 | 132.50 | 41.77 | 134.64 | 1.58 | 94.54 | 2.87 | 0.60 | 52.50 | 2.24 | 4.44 | ||||||
| 变异系数 | 0.01 | 0.13 | 0.12 | 0.46 | 0.45 | 0.77 | 0.56 | 0.37 | 0.15 | 0.22 | 0.76 | ||||||
表3 研究区地下水化学组分统计表
Table 3 Statistical table of chemical composition of groundwater in three study zones
| 区域 | 统计量 | pH | 地下水中各化学组分的指标参数统计值 | ||||||||||||||
|---|---|---|---|---|---|---|---|---|---|---|---|---|---|---|---|---|---|
| TDS | Cl- | F- | K+ | Na+ | Ca2+ | Mg2+ | |||||||||||
| 一区 | 最大值 | 7.97 | 963.00 | 461.16 | 376.63 | 115.85 | 76.08 | 1.33 | 1.86 | 37.49 | 220.71 | 68.14 | |||||
| 最小值 | 7.10 | 222.00 | 204.96 | 3.60 | 0.00 | 11.99 | 0.28 | 0.05 | 3.55 | <检出限 | 24.55 | ||||||
| 平均值 | 7.64 | 391.61 | 302.15 | 48.78 | 44.49 | 43.17 | 0.70 | 1.23 | 11.69 | 91.14 | 31.77 | ||||||
| 标准差 | 0.20 | 155.61 | 65.88 | 83.97 | 37.81 | 17.98 | 0.24 | 0.53 | 7.06 | 43.04 | 9.61 | ||||||
| 变异系数 | 0.03 | 0.40 | 0.22 | 1.72 | 0.85 | 0.42 | 0.34 | 0.43 | 0.60 | 0.47 | 0.30 | ||||||
| 二区 | 最大值 | 8.80 | 4 349.00 | 924.76 | 984.36 | 123.16 | 2 890.38 | 7.07 | 5.66 | 973.42 | 333.18 | 476.73 | |||||
| 最小值 | 7.08 | 274.00 | 31.72 | 4.71 | 0.44 | 17.99 | 0.71 | 0.33 | 28.14 | 3.59 | 1.50 | ||||||
| 平均值 | 7.96 | 1 031.38 | 438.27 | 209.92 | 8.84 | 395.00 | 2.91 | 1.35 | 261.08 | 81.93 | 72.75 | ||||||
| 标准差 | 0.55 | 1 047.07 | 193.14 | 263.43 | 27.14 | 735.41 | 1.81 | 1.26 | 234.02 | 98.49 | 113.32 | ||||||
| 变异系数 | 0.07 | 1.02 | 0.44 | 1.25 | 3.07 | 1.86 | 0.62 | 0.93 | 0.90 | 1.20 | 1.56 | ||||||
| 三区 | 最大值 | 8.51 | 1 179.00 | 405.04 | 463.45 | 5.77 | 242.52 | 9.33 | 2.60 | 429.25 | 13.87 | 14.41 | |||||
| 最小值 | 8.20 | 796.00 | 275.72 | 56.01 | 1.72 | 40.70 | 1.39 | 0.76 | 277.00 | 7.32 | 1.62 | ||||||
| 平均值 | 8.42 | 996.80 | 340.14 | 292.06 | 3.52 | 122.18 | 5.12 | 1.59 | 361.71 | 10.27 | 5.81 | ||||||
| 标准差 | 0.12 | 132.50 | 41.77 | 134.64 | 1.58 | 94.54 | 2.87 | 0.60 | 52.50 | 2.24 | 4.44 | ||||||
| 变异系数 | 0.01 | 0.13 | 0.12 | 0.46 | 0.45 | 0.77 | 0.56 | 0.37 | 0.15 | 0.22 | 0.76 | ||||||
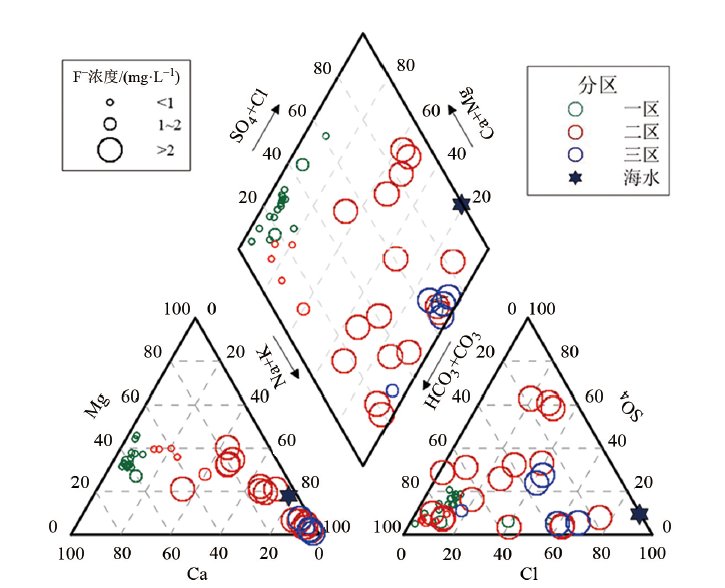
图3 研究区水样piper三线图
Fig.3 Piper plot for groundwater samples from the study area
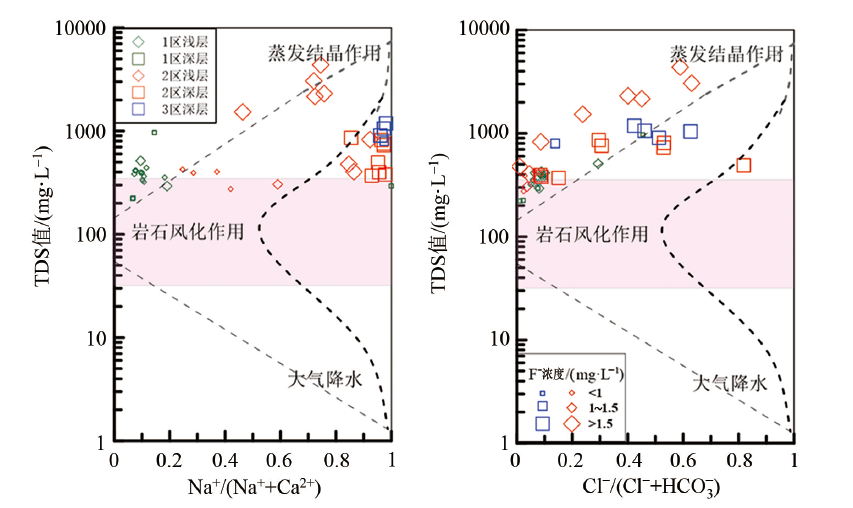
图4 水化学Gibbs图
Fig.4 Gibbs diagram for groundwater samples
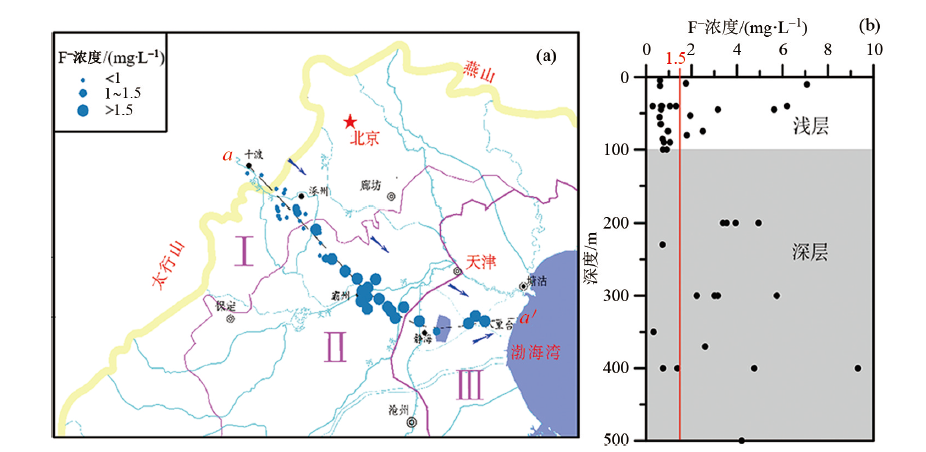
图5 研究区地下水氟浓度空间分布
Fig.5 (a) Horizontal distribution and (b) depth dependence of F- concentration in groundwater in the study area
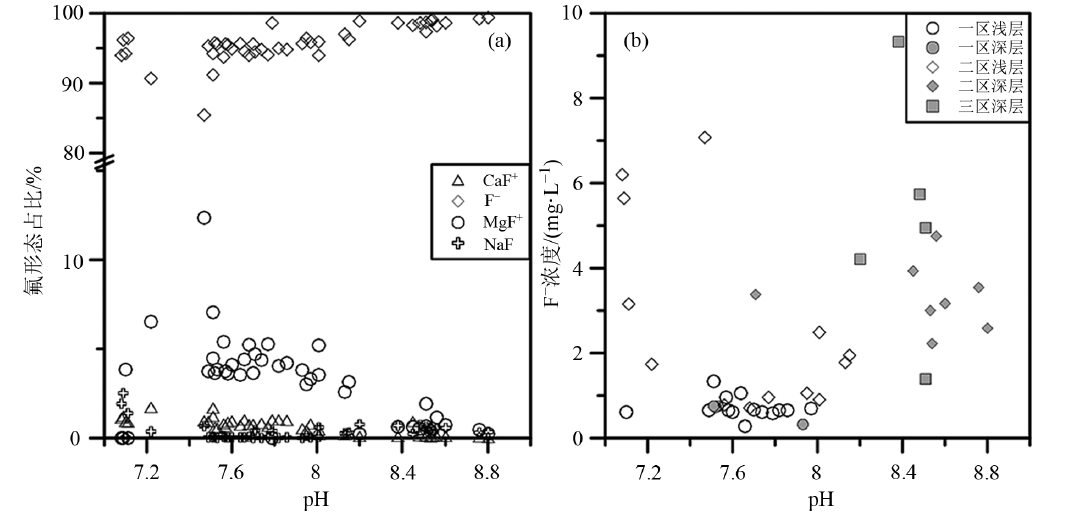
图6 地下水中pH与氟形态比例(a)和氟离子浓度(b)之间的变化关系
Fig.6 Relationship between pH and fluorine species percentage (a) or total F- concentration (b) in groundwater
| 区域 | 统计量 | 元素含量/(pmol·L-1) | ||||||||||||||||
|---|---|---|---|---|---|---|---|---|---|---|---|---|---|---|---|---|---|---|
| La | Ce | Pr | Nd | Sm | Eu | Gd | Tb | Dy | Ho | Er | Tm | Yb | Lu | |||||
| 一区 | 最小值 | 40 | 20 | 6 | 27 | 10 | 85 | 14 | 1 | 2 | 1 | 3 | 0 | 2 | 1 | |||
| 最大值 | 242 | 444 | 57 | 218 | 38 | 589 | 43 | 7 | 44 | 13 | 45 | 9 | 65 | 13 | ||||
| 平均值 | 124 | 135 | 24 | 102 | 22 | 209 | 26 | 3 | 19 | 5 | 16 | 2 | 16 | 3 | ||||
| 二区 | 最小值 | 36 | 27 | 6 | 16 | 8 | 18 | 10 | 1 | 5 | 1 | 4 | 1 | 2 | 1 | |||
| 最大值 | 982 | 1 503 | 273 | 835 | 342 | 559 | 404 | 49 | 224 | 32 | 85 | 13 | 61 | 14 | ||||
| 平均值 | 212 | 306 | 46 | 171 | 45 | 197 | 51 | 6 | 33 | 7 | 20 | 3 | 18 | 4 | ||||
| 三区 | 最小值 | 35 | 70 | 12 | 42 | 7 | 85 | 11 | 1 | 6 | 4 | 5 | 1 | 5 | 1 | |||
| 最大值 | 1 648 | 2 545 | 377 | 1 471 | 282 | 309 | 291 | 38 | 183 | 39 | 109 | 16 | 95 | 16 | ||||
| 平均值 | 514 | 822 | 120 | 471 | 91 | 181 | 89 | 12 | 60 | 13 | 36 | 5 | 29 | 5 | ||||
| 区域 | 统计量 | 元素含量/(pmol·L-1) | (La/Sm)UCC | (Gd/Yb)UCC | Ce/Ce* | Eu/Eu* | ||||||||||||
| ∑REE | ∑LREE | ∑HREE | ||||||||||||||||
| 一区 | 最小值 | 392 | 368 | 23 | 0.48 | 0.33 | 0.11 | 19.03 | ||||||||||
| 最大值 | 1 176 | 1 039 | 236 | 1.08 | 3.51 | 2.29 | 89.81 | |||||||||||
| 平均值 | 707 | 617 | 90 | 0.8 | 1.2 | 0.61 | 43.52 | |||||||||||
| 二区 | 最小值 | 174 | 113 | 31 | 0.33 | 0.22 | 0.31 | 2.27 | ||||||||||
| 最大值 | 4 631 | 3 786 | 846 | 2.77 | 4.26 | 1.52 | 90.62 | |||||||||||
| 平均值 | 1 119 | 977 | 142 | 0.74 | 1.62 | 0.8 | 43.04 | |||||||||||
| 三区 | 最小值 | 286 | 251 | 35 | 0.73 | 1.14 | 0.74 | 2.56 | ||||||||||
| 最大值 | 7 266 | 6 480 | 786 | 0.81 | 1.82 | 0.81 | 45.79 | |||||||||||
| 平均值 | 2 447 | 2 198 | 249 | 0.76 | 1.49 | 0.77 | 22.28 | |||||||||||
表4 研究区稀土元素含量及分异特征参数
Table 4 REE concentrations and fractionation parameters in groundwater collected from the North China Plain (NCP)
| 区域 | 统计量 | 元素含量/(pmol·L-1) | ||||||||||||||||
|---|---|---|---|---|---|---|---|---|---|---|---|---|---|---|---|---|---|---|
| La | Ce | Pr | Nd | Sm | Eu | Gd | Tb | Dy | Ho | Er | Tm | Yb | Lu | |||||
| 一区 | 最小值 | 40 | 20 | 6 | 27 | 10 | 85 | 14 | 1 | 2 | 1 | 3 | 0 | 2 | 1 | |||
| 最大值 | 242 | 444 | 57 | 218 | 38 | 589 | 43 | 7 | 44 | 13 | 45 | 9 | 65 | 13 | ||||
| 平均值 | 124 | 135 | 24 | 102 | 22 | 209 | 26 | 3 | 19 | 5 | 16 | 2 | 16 | 3 | ||||
| 二区 | 最小值 | 36 | 27 | 6 | 16 | 8 | 18 | 10 | 1 | 5 | 1 | 4 | 1 | 2 | 1 | |||
| 最大值 | 982 | 1 503 | 273 | 835 | 342 | 559 | 404 | 49 | 224 | 32 | 85 | 13 | 61 | 14 | ||||
| 平均值 | 212 | 306 | 46 | 171 | 45 | 197 | 51 | 6 | 33 | 7 | 20 | 3 | 18 | 4 | ||||
| 三区 | 最小值 | 35 | 70 | 12 | 42 | 7 | 85 | 11 | 1 | 6 | 4 | 5 | 1 | 5 | 1 | |||
| 最大值 | 1 648 | 2 545 | 377 | 1 471 | 282 | 309 | 291 | 38 | 183 | 39 | 109 | 16 | 95 | 16 | ||||
| 平均值 | 514 | 822 | 120 | 471 | 91 | 181 | 89 | 12 | 60 | 13 | 36 | 5 | 29 | 5 | ||||
| 区域 | 统计量 | 元素含量/(pmol·L-1) | (La/Sm)UCC | (Gd/Yb)UCC | Ce/Ce* | Eu/Eu* | ||||||||||||
| ∑REE | ∑LREE | ∑HREE | ||||||||||||||||
| 一区 | 最小值 | 392 | 368 | 23 | 0.48 | 0.33 | 0.11 | 19.03 | ||||||||||
| 最大值 | 1 176 | 1 039 | 236 | 1.08 | 3.51 | 2.29 | 89.81 | |||||||||||
| 平均值 | 707 | 617 | 90 | 0.8 | 1.2 | 0.61 | 43.52 | |||||||||||
| 二区 | 最小值 | 174 | 113 | 31 | 0.33 | 0.22 | 0.31 | 2.27 | ||||||||||
| 最大值 | 4 631 | 3 786 | 846 | 2.77 | 4.26 | 1.52 | 90.62 | |||||||||||
| 平均值 | 1 119 | 977 | 142 | 0.74 | 1.62 | 0.8 | 43.04 | |||||||||||
| 三区 | 最小值 | 286 | 251 | 35 | 0.73 | 1.14 | 0.74 | 2.56 | ||||||||||
| 最大值 | 7 266 | 6 480 | 786 | 0.81 | 1.82 | 0.81 | 45.79 | |||||||||||
| 平均值 | 2 447 | 2 198 | 249 | 0.76 | 1.49 | 0.77 | 22.28 | |||||||||||

图7 研究区地下水Nd、∑REE含量变化图(a)以及∑REE含量随深度变化图(b)
Fig.7 Horizontal variations of Nd content and ∑REE (a) and vertical variation of ∑REE (b) in groundwater in the study area
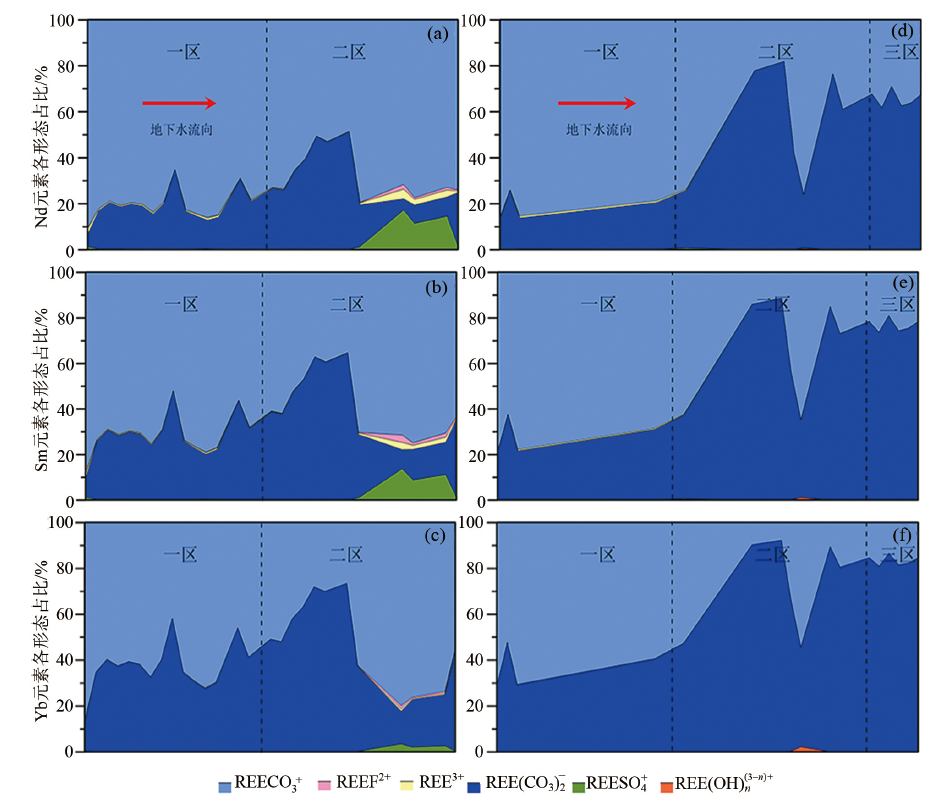
图8 研究区地下水Nd、Sm、Yb元素形态模拟结果 a,b,c为浅层地下水;d,e,f为深层地下水。
Fig.8 Simulated Nd, Sm and Yb speciations in shallow (a, b, c) and deep (d, e, f) groundwater in the study area
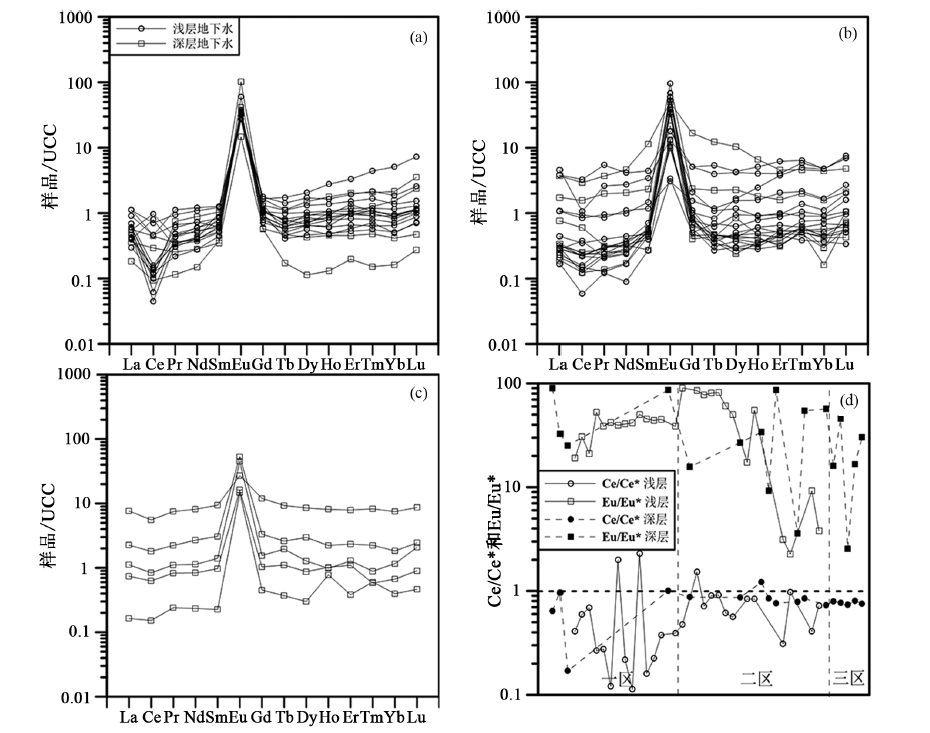
图9 研究区地下水平均上陆壳标准化稀土元素配分模式 a,b,c分别为一区、二区、三区情况;d为Ce异常和Eu异常的变化情况。
Fig.9 UCC-normalized REE pattern for groundwater in study zones I-III (a-c) and horizontal variations of Ce/Ce* and Eu/Eu* (d) in groundwater in the study area
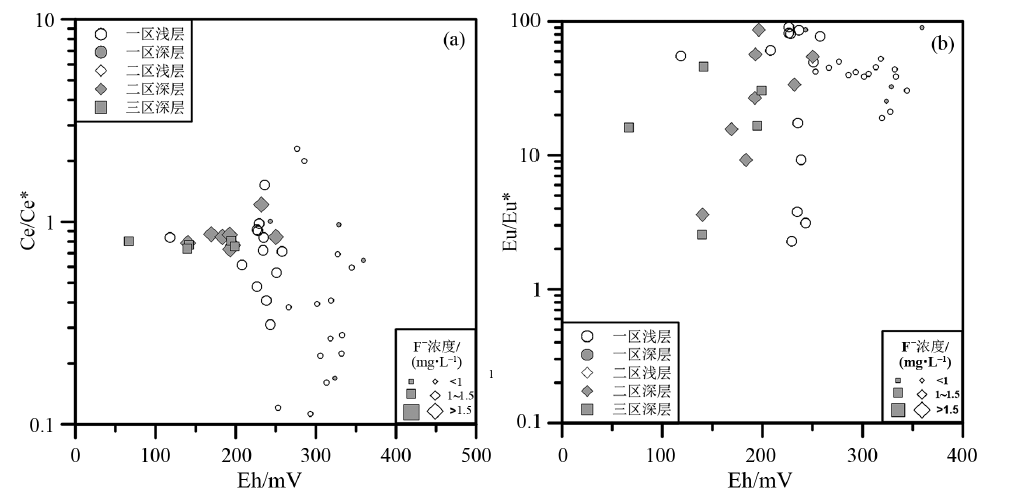
图10 研究区地下水中Eh值与Ce/Ce*(a)、Eu/Eu*(b)之间的变化关系
Fig.10 Relationship between Eh and Ce/Ce* (a) or Eu/Eu* (b) in groundwater in the study area
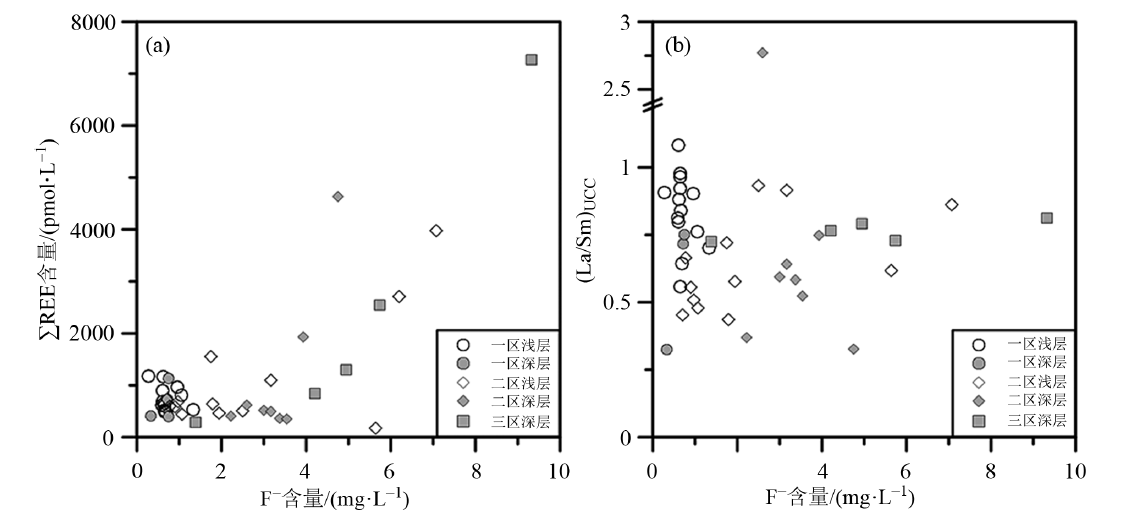
图11 研究区地下水中F-浓度与∑REE含量(a)、(La/Sm)UCC(b)之间的变化关系
Fig.11 Relationship between F- concentration and ∑REE (a) or (La/Sm)UCC (b) in groundwater in the study area
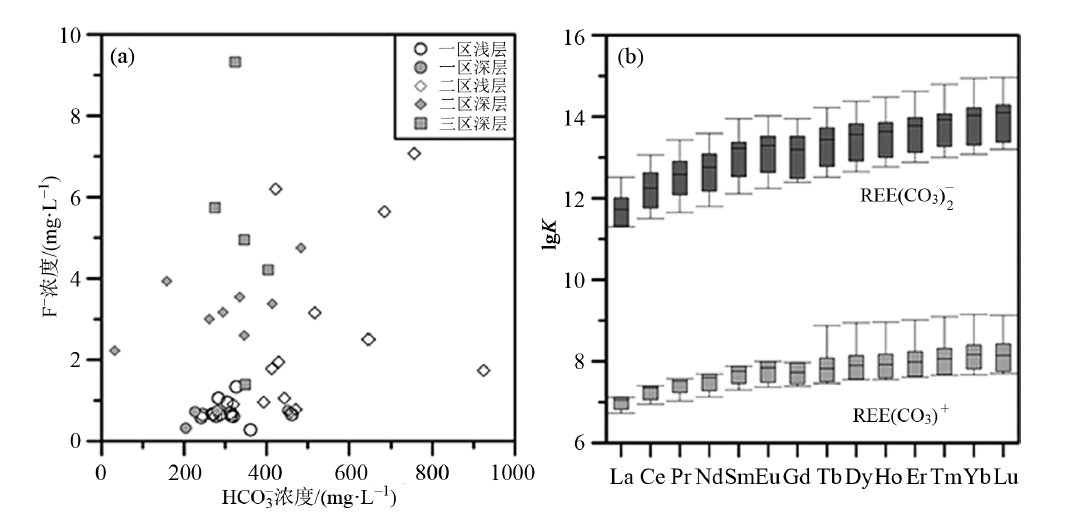
图12 研究区地下水中 HCO 3 -浓度与F-浓度之间的变化关系(a)和稀土元素碳酸根络合反应稳定平衡常数(K)随原子序数的变化(b)(图b数据来源文献[26,28,39⇓-41])
Fig.12 (a) Relationship between HCO 3 - and F- in groundwater and (b) variation of equilibrium constants for REE-carbonate complexation reactions with increasing atomic number (data from [26,28,39⇓-41])
| [1] |
WANG G, CHENG G. Fluoride distribution in water and the governing factors of environment in arid north-west China[J]. Journal of Arid Environments, 2001, 49(3): 601-614.
DOI URL |
| [2] | MSONDA K W M, MASAMBA W R L, FABIANO E. A study of fluoride groundwater occurrence in Nathenje, Lilongwe, Malawi[J]. Physics and Chemistry of the Earth, 2007, 32(15): 1178-1184. |
| [3] |
SU C L, WANG Y X, XIE X J, et al. Aqueous geochemistry of high-fluoride groundwater in Datong Basin, Northern China[J]. Journal of Geochemical Exploration, 2013, 135: 79-92.
DOI URL |
| [4] |
FUGE R. Fluorine in the environment, a review of its sources and geochemistry[J]. Applied Geochemistry, 2019, 100: 393-406.
DOI URL |
| [5] | 何锦, 张福存, 韩双宝, 等. 中国北方高氟地下水分布特征和成因分析[J]. 中国地质, 2010, 37(3): 621-626. |
| [6] |
RAFIQUE T, NASEEM S, HAIDER T, et al. Geochemical factors controlling the occurrence of high fluoride groundwater in the Nagar Parkar area, Sindh, Pakistan[J]. Journal of Hazardous Materials, 2009, 171(1/2/3): 424-430.
DOI URL |
| [7] | SCHAFER D, SUN J, JAMIESON J, et al. Fluoride release from carbonate-rich fluorapatite during managed aquifer recharge: model-based development of mitigation strategies[J]. Water Research, 2021, 193: 116880. |
| [8] |
SAJIL KUMAR P J, JEGATHAMBAL P, JAMES E J. Factors influencing the high fluoride concentration in groundwater of Vellore District, South India[J]. Environmental Earth Sciences, 2014, 72(7): 2437-2446.
DOI URL |
| [9] |
MATTHEW C, IAN C, MASSIMO R, et al. Controls on elevated fluoride and arsenic concentrations in groundwater from the Yuncheng Basin, China[J]. Applied Geochemistry, 2011, 26(4): 540-552.
DOI URL |
| [10] |
JACKS G, BHATTACHARYA P, CHAUDHARY V, et al. Controls on the genesis of some high-fluoride groundwaters in India[J]. Applied Geochemistry, 2005, 20(2):221-228.
DOI URL |
| [11] |
KIM K, JEONG G Y. Factors influencing natural occurrence of fluoride-rich groundwaters: a case study in the southeastern part of the Korean Peninsula[J]. Chemosphere, 2005, 58(10): 1399-1408.
DOI URL |
| [12] |
JOHANNESSON K, STETZENBACH K, HODGE V. Rare earth elements as geochemical tracers of regional groundwater mixing[J]. Geochimica et Cosmochimica Acta, 1997, 61(17): 3605-3618.
DOI URL |
| [13] |
TANG J, JOHANNESSON K H. Controls on the geochemistry of rare earth elements along a groundwater flow path in the Carrizo Sand aquifer, Texas, USA[J]. Chemical Geology, 2006, 225(1/2): 156-171.
DOI URL |
| [14] |
CHEVIS D A., JOHANNESSON K H, BURDIGE D J, et al. Submarine groundwater discharge of rare earth elements to a tidally-mixed estuary in Southern Rhode Island[J]. Chemical Geology, 2015, 397: 128-142.
DOI URL |
| [15] | 周海玲, 苏春利, 李俊霞, 等. 大同盆地沉积物REE分布特征及其对碘富集的指示[J]. 地球科学, 2017, 42(2): 298-306. |
| [16] | WILLIS S S. Trace element geochemistry in groundwater flow systems[D]. Arlington: the University of Texas at Arlington, 2010. |
| [17] |
DECRÉE S, POURRET O, BAELE J M. Rare earth element fractionation in heterogenite (CoOOH): implication for cobalt oxidized ore in the Katanga Copperbelt (Democratic Republic of Congo)[J]. Journal of Geochemical Exploration, 2015, 159: 290-301.
DOI URL |
| [18] |
GUO H, BO Z, WANG G, et al. Geochemical controls on arsenic and rare earth elements approximately along a groundwater flow path in the shallow aquifer of the Hetao Basin, Inner Mongolia[J]. Chemical Geology, 2010, 270(1-4): 117-125.
DOI URL |
| [19] | 张兆吉, 费宇红, 陈宗宇. 华北平原地下水可持续利用调查评价[M]. 北京: 地质出版社, 2009. |
| [20] | 王金翠, 张英, 温吉利, 等. 华北平原气候时空演变特征[J]. 现代地质, 2015, 29(2): 299-306. |
| [21] | 张宗祜, 沈照理, 薛禹群. 华北平原地下水环境演化[M]. 北京: 地质出版社, 2000. |
| [22] | NORDSTROM D K, PLUMMER L N, LANGMUIR D, et al. Revised chemical equilibrium data for major water-mineral reactions and their limitations[M]// BASSETT R L, MELCHIOR D. Chemical modeling in aqueous systems II. Washington: American Chemical Society, 1990, 416: 398-413. |
| [23] | NORDSTROM D K, MAY H M. Aqueous equilibrium data for mononuclear aluminum species[M]//SPOSITO G. The environmental chemistry of aluminum. Boca Raton: CRC Press Inc, 1996: 39-80. |
| [24] |
KLUNGNESS G D, BYRNE R H. Comparative hydrolysis behavior of the rare earths and yttrium: the influence of temperature and ionic strength[J]. Polyhedron, 2000, 19(1): 99-107.
DOI URL |
| [25] | LEE J H, BYRNE R H. Examination of comparative rare earth element complexation behavior using linear free-energy relationships[J]. Pergamon, 1992, 56(3): 1127-1137. |
| [26] | LUO Y R, BYRNE R H. Carbonate complexation of yttrium and the rare earth elements in natural waters[J]. Geochimica et Cosmochimica Acta, 2004, 68(4): 0-699. |
| [27] |
SCHIJF J, BYRNE R H. Determination of SO4β1 for yttrium and the rare earth elements at I=0.66 m and t=25 ℃: implications for YREE solution speciation in sulfate-rich waters[J]. Geochimica et Cosmochimica Acta, 2004, 68(13): 2825-2837.
DOI URL |
| [28] | MILLERO F J. Stability constants for the formation of rare earth-inorganic complexes as a function of ionic strength[J]. Pergamon, 1992, 56(8): 3123-3132. |
| [29] |
MIGDISOV A A, WILLIAMS-JONES A E, WAGNER T. An experimental study of the solubility and speciation of the Rare Earth Elements (III) in fluoride and chloride-bearing aqueous solutions at temperatures up to 300℃[J]. Geochimica et Cosmochimica Acta, 2009, 73(23): 7087-7109.
DOI URL |
| [30] | 张威, 傅新锋, 张甫仁. 地下水中氟含量与温度、pH值、(Na++K+)/Ca2+的关系: 以河南省永城矿区为例[J]. 地质与资源, 2004, 13(2): 109-111, 95. |
| [31] | 刘海燕. 华北平原典型区地下水稀土元素的分布特征及其与铁、锰络合反应的模拟研究[D]. 北京: 中国地质大学(北京), 2018. |
| [32] | 王亚平, 王岚, 许春雪, 等. 长江水系水文地球化学特征及主要离子的化学成因[J]. 地质通报, 2010, 29(2): 446-456. |
| [33] |
DENG Y M, NORDSTROM D K, MCCLESKEY R B. Fluoride geochemistry of thermal waters in Yellowstone National Park: I. Aqueous fluoride speciation[J]. Geochimica et Cosmochimica Acta, 2011, 75(16): 4476-4489.
DOI URL |
| [34] | MCLENNAN S M. Relationships between the trace element composition of sedimentary rocks and upper continental crust[J]. Geochemistry, Geophysics, Geosystems, 2001, 2(4): 1021. |
| [35] | 王慧群, 胡斌, 滕彦国, 等. 拉林河流域地下水中稀土元素质量浓度及分异特征[J]. 南水北调与水利科技(中英文), 2021, 19(1): 158-167. |
| [36] |
LIU H, GUO H, XING L, et al. Geochemical behaviors of rare earth elements in groundwater along a flow path in the North China Plain[J]. Journal of Asian Earth Sciences, 2016, 117: 33-51
DOI URL |
| [37] |
WILKIN R T, LEE T R, LUDWIG R D, et al. Rare-earth elements as natural tracers for in situ remediation of groundwater[J]. Environmental Science and Technology, 2021, 55(2): 1251-1259.
DOI URL |
| [38] | 樊连杰, 裴建国, 卢丽, 等. 桂林寨底地下河系统中地下水稀土元素含量及分异特征[J]. 中国稀土学报, 2018, 36(2): 247-256. |
| [39] |
LEE J H, BYRNE R H. Complexation of trivalent rare earth elements (Ce, Eu, Gd, Tb, Yb) by carbonate ions[J]. Geochimica et Cosmochimica Acta, 1993, 57(2): 295-302.
DOI URL |
| [40] |
OHTA A, KAWABE I. Rare earth element partitioning between Fe oxyhydroxide precipitates and aqueous NaCl solutions doped with NaHCO3: determinations of rare earth element complexation constants with carbonate ions[J]. Geochemical Journal, 2000, 34(6): 439-454.
DOI URL |
| [41] |
LIU X W, BYRNE R H. Comprehensive investigation of yttrium and rare earth element complexation by carbonate ions using ICP-mass spectrometry[J]. Journal of Solution Chemistry, 1998, 27(9): 803-815.
DOI URL |
| [42] |
DUPRÉ B, GAILLARDET J, ROUSSEAU D, et al. Major and trace elements of river-borne material: the Congo Basin[J]. Geochimica et Cosmochimica Acta, 1996, 60(8): 1301-1321.
DOI URL |
| [43] |
LEYBOURNE M I, GOODFELLOW W D, BOYLE D R, et al. Rapid development of negative Ce anomalies in surface waters and contrasting REE patterns in groundwaters associated with Zn-Pb massive sulphide deposits[J]. Applied Geochemistry, 2000, 15(6): 695-723.
DOI URL |
| [44] |
LI J, ZHOU H, QIAN K, et al. Fluoride and iodine enrichment in groundwater of North China Plain: evidences from speciation analysis and geochemical modeling[J]. Science of the Total Environment, 2017, 598: 239-248.
DOI URL |
| [45] |
KUMAR M, DAS N, GOSWAMI R, et al. Coupling fractionation and batch desorption to understand arsenic and fluoride co-contamination in the aquifer system[J]. Chemosphere, 2016, 164: 657-667.
DOI URL |
| [46] |
KIM S H, KIM K, KO K S, et al. Co-contamination of arsenic and fluoride in the groundwater of unconsolidated aquifers under reducing environments[J]. Chemosphere, 2012, 87(8): 851-856.
DOI URL |
| [1] | 刘玲霞, 路睿, 谢文苹, 刘博, 王亚茹, 姚海慧, 蔺文静. 青藏高原东北部温泉分布及水文地球化学特征[J]. 地学前缘, 2024, 31(6): 173-195. |
| [2] | 董姝, 刘海燕, 张一帆, 王振, 郭华明, 孙占学, 周仲魁. 相山铀矿尾矿区植物—根际土壤稀土元素和铀、钍生物富集特征[J]. 地学前缘, 2024, 31(6): 474-489. |
| [3] | 周伟, 马啸, 陈文毅, 高锐, 王雁, 胡大伟. 华北平原蓟县系雾迷山组碳酸盐岩热储岩体原位环境下力学特性研究[J]. 地学前缘, 2024, 31(6): 95-103. |
| [4] | 兰春元, 张立飞, 陶仁彪, 胡晗, 张丽娟, 王超. 基于DEW模型的地球深部流体组成与水岩相互作用计算方法综述[J]. 地学前缘, 2024, 31(1): 64-76. |
| [5] | 郭华明, 尹嘉鸿, 严松, 刘超. 陕北靖边高铬地下水中硝酸根分布及来源[J]. 地学前缘, 2024, 31(1): 384-399. |
| [6] | 张广禄, 刘海燕, 郭华明, 孙占学, 王振, 吴通航. 华北平原典型山前冲洪积扇高硝态氮地下水分布特征及健康风险评价[J]. 地学前缘, 2023, 30(4): 485-503. |
| [7] | 郭华明, 高志鹏, 修伟. 地下水典型氧化还原敏感组分迁移转化的研究热点和趋势[J]. 地学前缘, 2022, 29(3): 64-75. |
| [8] | 周长松, 邹胜章, 冯启言, 朱丹尼, 李军, 王佳, 谢浩, 邓日欣. 岩溶关键带水文地球化学研究进展[J]. 地学前缘, 2022, 29(3): 37-50. |
| [9] | 王广才, 王焰新, 刘菲, 郭华明. 基于文献计量学分析水文地球化学研究进展及趋势[J]. 地学前缘, 2022, 29(3): 25-36. |
| [10] | 刘妍君, 马腾, 杜尧, 刘锐. 黏性土弱透水层压实作用:原理、技术及其水文地质意义[J]. 地学前缘, 2021, 28(5): 59-67. |
| [11] | 马月花, 唐保春, 苏生云, 张盛生, 李成英. 青海共和盆地地热流体地球化学特征及热储水-岩相互作用过程[J]. 地学前缘, 2020, 27(1): 123-133. |
| [12] | 吴初,武雄,张艳帅,岩岩,朱鹏程. 秦皇岛牛心山高氟地下水分布特征及成因[J]. 地学前缘, 2018, 25(4): 307-315. |
| [13] | 徐永强,李紫晶,郭冀隆,陈家玮. 页岩储层-超临界CO2-模拟压裂液相互作用实验研究及其环境意义[J]. 地学前缘, 2018, 25(4): 245-254. |
| [14] | 赵贤正,李飞,曾溅辉,金凤鸣,张汪明,刘佳,张继伟. 霸县凹陷深部地下热水的地球化学特征及其成因[J]. 地学前缘, 2017, 24(3): 210-218. |
| [15] | 毛若愚, 郭华明, 贾永锋, 姜玉肖, 曹永生, 赵威光, 王振. 内蒙古河套盆地含氟地下水分布特点及成因[J]. 地学前缘, 2016, 23(2): 260-268. |
| 阅读次数 | ||||||
|
全文 |
|
|||||
|
摘要 |
|
|||||