Earth Science Frontiers ›› 2022, Vol. 29 ›› Issue (5): 372-381.DOI: 10.13745/j.esf.sf.2021.9.55
Previous Articles Next Articles
YAN Qing( )
)
Received:2021-08-05
Revised:2021-09-10
Online:2022-09-25
Published:2022-08-24
CLC Number:
YAN Qing. Climate change and the associated glacier response in High-Mountain Asia during the mid-Holocene: A modeling study[J]. Earth Science Frontiers, 2022, 29(5): 372-381.
| 编号 | 模式名称 | 机构(国家) | 分辨率/格点数 |
|---|---|---|---|
| 1 | AWI-ESM-1-1-LR | Alfred Wegener Institute (Germany) | 192×96 |
| 2 | CESM2 | National Center for Atmospheric Research (USA) | 288×192 |
| 3 | EC-Earth3-LR | Stockholm University (Sweden) | 320×160 |
| 4 | FGOALS-f3-L | Institute of Atmospheric Physics (China) | 288×180 |
| 5 | FGOALS-g3 | Institute of Atmospheric Physics (China) | 180×90 |
| 6 | GISS-E2-1-G | NASA Goddard Institute for Space Studies (USA) | 144×90 |
| 7 | INM-CM4-8 | Institute of Numerical Mathematics (Russia) | 180×120 |
| 8 | IPSL-CM6A-LR | Institut Pierre Simon Laplace (France) | 144×143 |
| 9 | MIROC-ES2L | Japan Agency for Marine-Earth Science and Technology, The University of Tokyo (Japan) | 128×64 |
| 10 | NESM3 | Nanjing University of Information Science and Technology (China) | 192×96 |
| 11 | NorESM1-F | Bjerknes Centre for Climate Research (Norway) | 144×96 |
Table 1 Information of the PMIP4 climate models (see https://pmip4.lsce.ipsl.fr/ for details)
| 编号 | 模式名称 | 机构(国家) | 分辨率/格点数 |
|---|---|---|---|
| 1 | AWI-ESM-1-1-LR | Alfred Wegener Institute (Germany) | 192×96 |
| 2 | CESM2 | National Center for Atmospheric Research (USA) | 288×192 |
| 3 | EC-Earth3-LR | Stockholm University (Sweden) | 320×160 |
| 4 | FGOALS-f3-L | Institute of Atmospheric Physics (China) | 288×180 |
| 5 | FGOALS-g3 | Institute of Atmospheric Physics (China) | 180×90 |
| 6 | GISS-E2-1-G | NASA Goddard Institute for Space Studies (USA) | 144×90 |
| 7 | INM-CM4-8 | Institute of Numerical Mathematics (Russia) | 180×120 |
| 8 | IPSL-CM6A-LR | Institut Pierre Simon Laplace (France) | 144×143 |
| 9 | MIROC-ES2L | Japan Agency for Marine-Earth Science and Technology, The University of Tokyo (Japan) | 128×64 |
| 10 | NESM3 | Nanjing University of Information Science and Technology (China) | 192×96 |
| 11 | NorESM1-F | Bjerknes Centre for Climate Research (Norway) | 144×96 |

Fig.1 Observed (a) and modelled (b) glacier distribution during the present-day.

Fig.2 Difference in temperature (℃) over High-mountain Asia between the mid-Holocene and preindustrial for (a) annual mean, (b) summer season, and (c) winter season based on the multimodel ensemble mean from PMIP4.
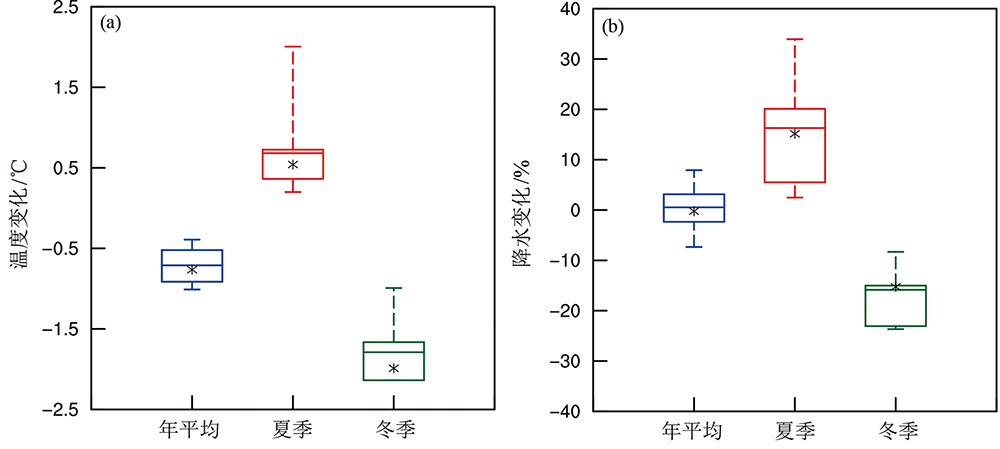
Fig.3 Box-plot for difference in temperature (a) and precipitation (b) between the mid-Holocene and preindustrial averaged across High-mountain Asia based on the 11 PMIP4 models. In a box-plot, the horizontal lines from top to below represent the maximum value, the 75th percentile, the mean, the 25th percentile, and the minimum value (the asterisk shows the median), respectively.

Fig.4 Difference in precipitation (%) over High-mountain Asia between the mid-Holocene and preindustrial for (a) annual mean, (b) summer season, and (c) winter season based on the multimodel ensemble mean from PMIP4
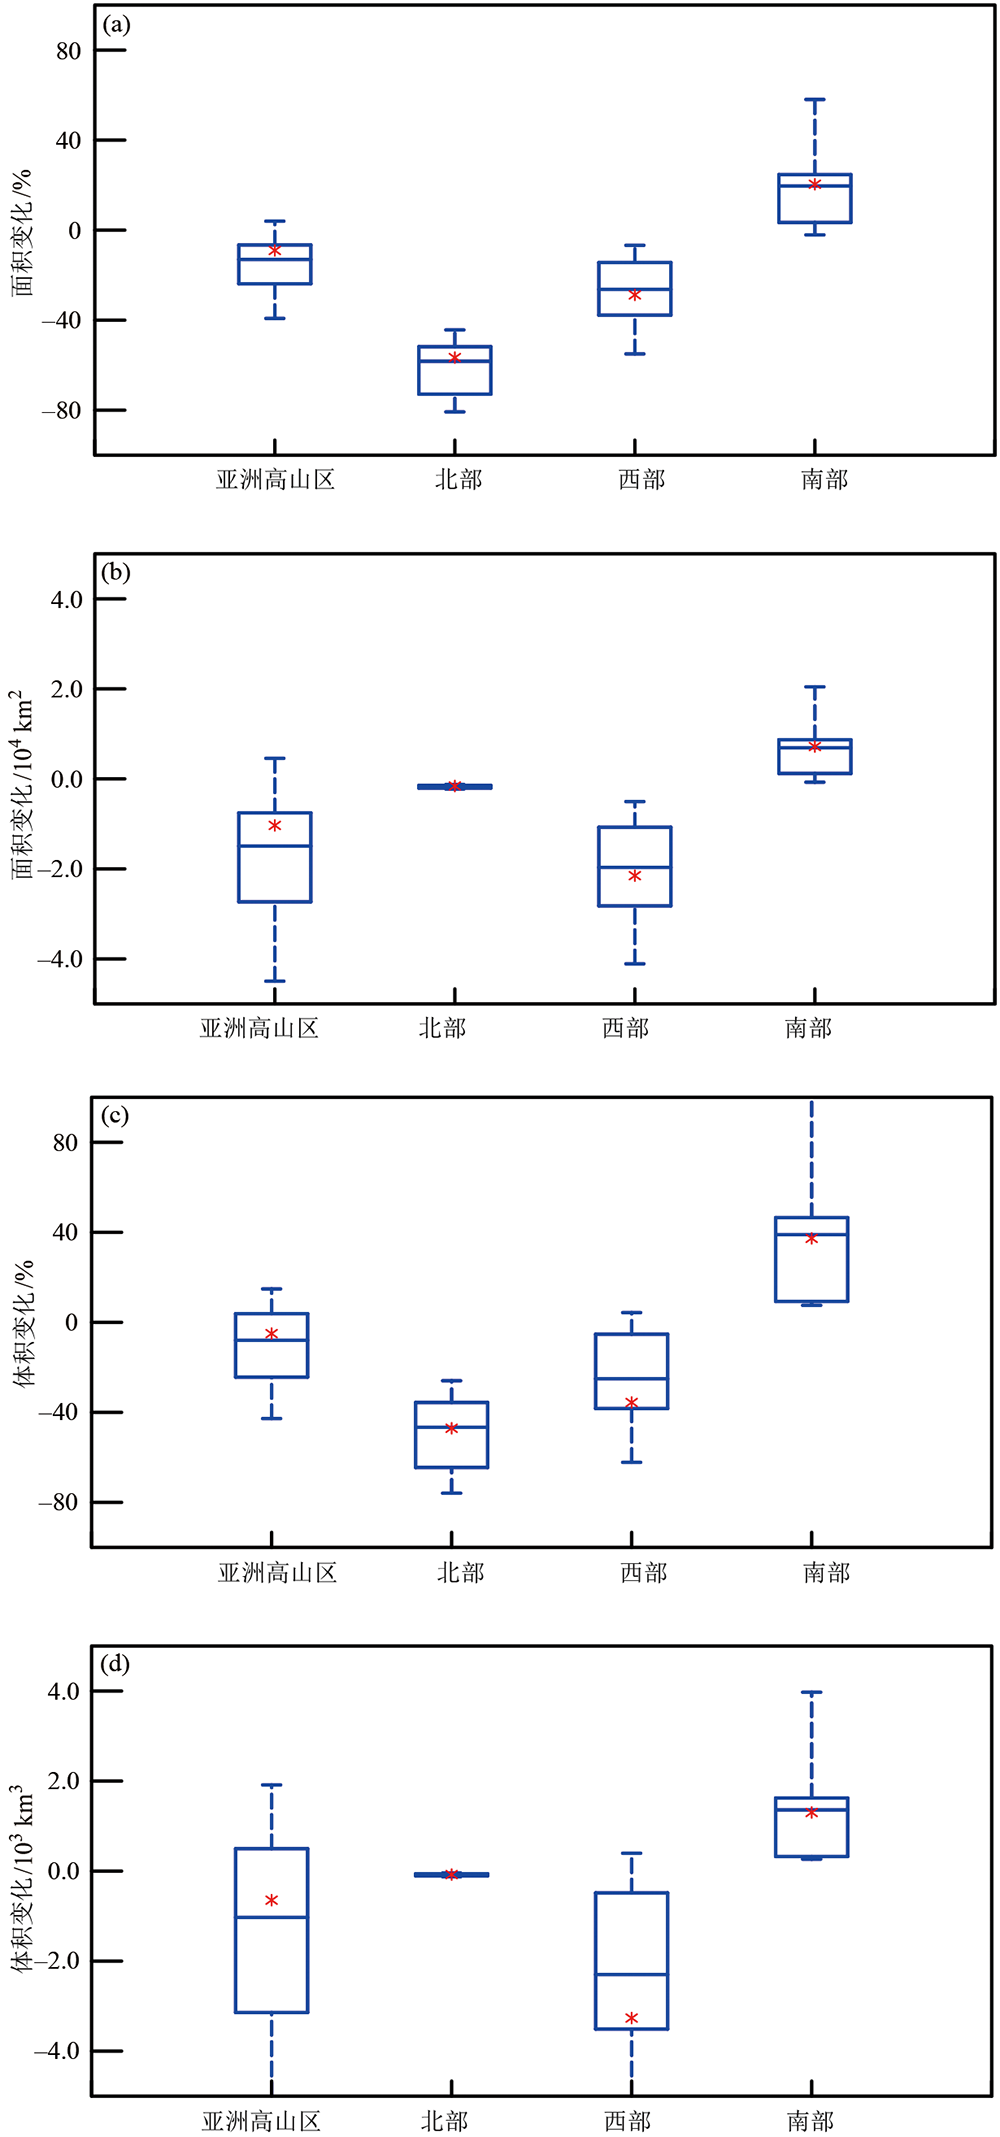
Fig.5 Box-plot for relative (a, c) and absolute (b, c) changes in glacier area (a, b) and volume (c, d) between the mid-Holocene and preindustrial averaged across the High-mountain Asia and its three sub-regions based on the 11 PMIP4 models. In a box-plot, the horizontal lines from top to below represent the maximum value, the 75th percentile, the mean, the 25th percentile, and theminimum value (the asterisk shows the median), respectively.

Fig.6 (a) Spatial distribution of change in glacier extent between the mid-Holocene and preindustrial with the climatic forcing from the PMIP4 multimodel ensemble mean. (b) Relative change in glacier area between the mid-Holocene and preindustrial averaged across the High-mountain Asia and its three sub-regions. The grey bars show the effects of both of temperature and precipitation change, with the red (blue) bars representing the influence of only temperature (precipitation) change.
| [1] | RGI C, NOSENKO G. Randolph glacier inventory(RGI): a dataset of global glacier outlines:Version 6.0[R]. Colorado, USA: Global Land Ice Measurements from Space, 2017. |
| [2] |
XU J C, GRUMBINER E, SHRESTHA A, et al. The melting Himalayas: cascading effects of climate change on water, biodiversity, and livelihoods[J]. Conservation Biology: the Journal of the Society for Conservation Biology, 2009, 23(3): 520-530.
DOI URL |
| [3] | 吴海斌, 李琴, 于严严, 等. 全新世中期中国气候格局定量重建[J]. 第四纪研究, 2017, 37(5): 982-998. |
| [4] |
CHEN F H, ZHANG J F, LIU J B, et al. Climate change, vegetation history, and landscape responses on the Tibetan Plateau during the Holocene: a comprehensive review[J]. Quaternary Science Reviews, 2020, 243: 106444.
DOI URL |
| [5] |
WANG Y J, CHENG H, EDWARDS R L, et al. The Holocene Asian monsoon: links to solar changes and North Atlantic climate[J]. Science, 2005, 308(5723): 854-857.
DOI URL |
| [6] |
FLEITMANN D, BURNS S J, MUDELSEE M, et al. Holocene forcing of the Indian monsoon recorded in a stalagmite from southern Oman[J]. Science, 2003, 300(5626): 1737-1739.
DOI URL |
| [7] |
JIANG D B, LANG X M, TIAN Z P, et al. Considerable model-data mismatch in temperature over China during the mid-Holocene: results of PMIP simulations[J]. Journal of Climate, 2012, 25(12): 4135-4153.
DOI URL |
| [8] |
JIANG D B, TIAN Z P, LANG X M. Mid-Holocene global monsoon area and precipitation from PMIP simulations[J]. Climate Dynamics, 2015, 44(9/10): 2493-2512.
DOI URL |
| [9] |
WANG T, WANG H J, JIANG D B. Mid-Holocene East Asian summer climate as simulated by the PMIP2 models[J]. Palaeogeography, Palaeoclimatology, Palaeoecology, 2010, 288(1/2/3/4): 93-102.
DOI URL |
| [10] |
JIANG D B, LANG X M, TIAN Z P, et al. Mid-Holocene east Asian summer monsoon strengthening: insights from paleoclimate modeling intercomparison project (PMIP) simulations[J]. Palaeogeography, Palaeoclimatology, Palaeoecology, 2013, 369(369): 422-429.
DOI URL |
| [11] |
JIANG D B, TIAN Z P, LANG X M. Mid-Holocene net precipitation changes over China: model-data comparison[J]. Quaternary Science Reviews, 2013, 82: 104-120.
DOI URL |
| [12] | TIAN Z P, JIANG D B. Mid-Holocene and last glacial maximum changes in monsoon area and precipitation over China[J]. Chinese Science Bulletin, 2015, 60(4): 400-410. |
| [13] | 易朝路. 第四纪冰川年代学以及新技术研究的现状、问题与趋势[J]. 第四纪研究, 2018, 38(3): 537-561. |
| [14] |
SAHA S, OWEN L A, ORR E N, et al. High-frequency Holocene glacier fluctuations in the Himalayan-Tibetan orogen[J]. Quaternary Science Reviews, 2019, 220: 372-400.
DOI URL |
| [15] |
LI C G, WANG M D, LIU W G, et al. Quantitative estimates of Holocene glacier meltwater variations on the Western Tibetan Plateau[J]. Earth and Planetary Science Letters, 2021, 559: 116766.
DOI URL |
| [16] |
OTTO-BLIESNER B L, BRACONNOT P, HARRISON S P, et al. The PMIP4 contribution to CMIP6-part 2: two interglacials, scientific objective and experimental design for Holocene and Last Interglacial simulations[J]. Geoscientific Model Development, 2017, 10(11), 3979-4003.
DOI URL |
| [17] |
WINKELMANN R, MARTIN M A, HASELOFF M, et al. The Potsdam parallel ice sheet model (PISM-PIK)-part 1: model description[J]. The Cryosphere, 2011, 5(3): 715-726.
DOI URL |
| [18] |
YAN Q, OWEN L A, ZHANG Z S, et al. Deciphering the evolution and forcing mechanisms of glaciation over the Himalayan-Tibetan orogen during the past 20,000 years[J]. Earth and Planetary Science Letters, 2020, 541: 116295.
DOI URL |
| [19] |
YAN Q, OWEN L A, WANG H J, et al. Climate constraints on glaciation over high‐mountain Asia during the last glacial maximum[J]. Geophysical Research Letters, 2018, 45 (17): 9024-9033.
DOI URL |
| [20] |
YAN Q, ZHANG Z S, WANG H J. Investigating uncertainty in the simulation of the Antarctic ice sheet during the mid-Piacenzian[J]. Journal of Geophysical Research:Atmospheres, 2016, 121(4): 1559-1574.
DOI URL |
| [21] |
WANG X, TOLKSDORF V, OTTO M, et al. WRF-based dynamical downscaling of ERA5 reanalysis data for High Mountain Asia: towards a new version of the High Asia Refined analysis[J]. International Journal of Climatology, 2021, 41(1): 743-762.
DOI URL |
| [22] | HUFFMAN G J, BOLVIN D T, BRAITHWAITE K, et al. Integrated Multi-satellitE Retrievals for GPM (IMERG), version 4.4[EB/OL].[2020-10-20]. NASA's Precipitation Processing Center, ftp://arthurhou.pps.eosdis.nasa.gov/gpmdata/. |
| [23] |
RUPPER S, ROE G, GILLESPIE A. Spatial patterns of Holocene glacier advance and retreat in Central Asia[J]. Quaternary Research, 2009, 72(3): 337-346.
DOI URL |
| Viewed | ||||||
|
Full text |
|
|||||
|
Abstract |
|
|||||