Earth Science Frontiers ›› 2023, Vol. 30 ›› Issue (5): 553-566.DOI: 10.13745/j.esf.sf.2023.2.73
TONG Changliang1,2,3( ), ZHU Yu1,3, WU Xiangbai4,*(), MO Yingming2, WANG Xuemu3
Received:2022-01-01
Revised:2023-01-01
Online:2023-09-25
Published:2023-10-20
CLC Number:
TONG Changliang, ZHU Yu, WU Xiangbai, MO Yingming, WANG Xuemu. Estimating bedload transport at the eastern entrance to the Qiongzhou Strait by numerical simulation[J]. Earth Science Frontiers, 2023, 30(5): 553-566.

Fig.1 Topography of the eastern entrance to the Qiongzhou Strait and distribution of monitoring stations
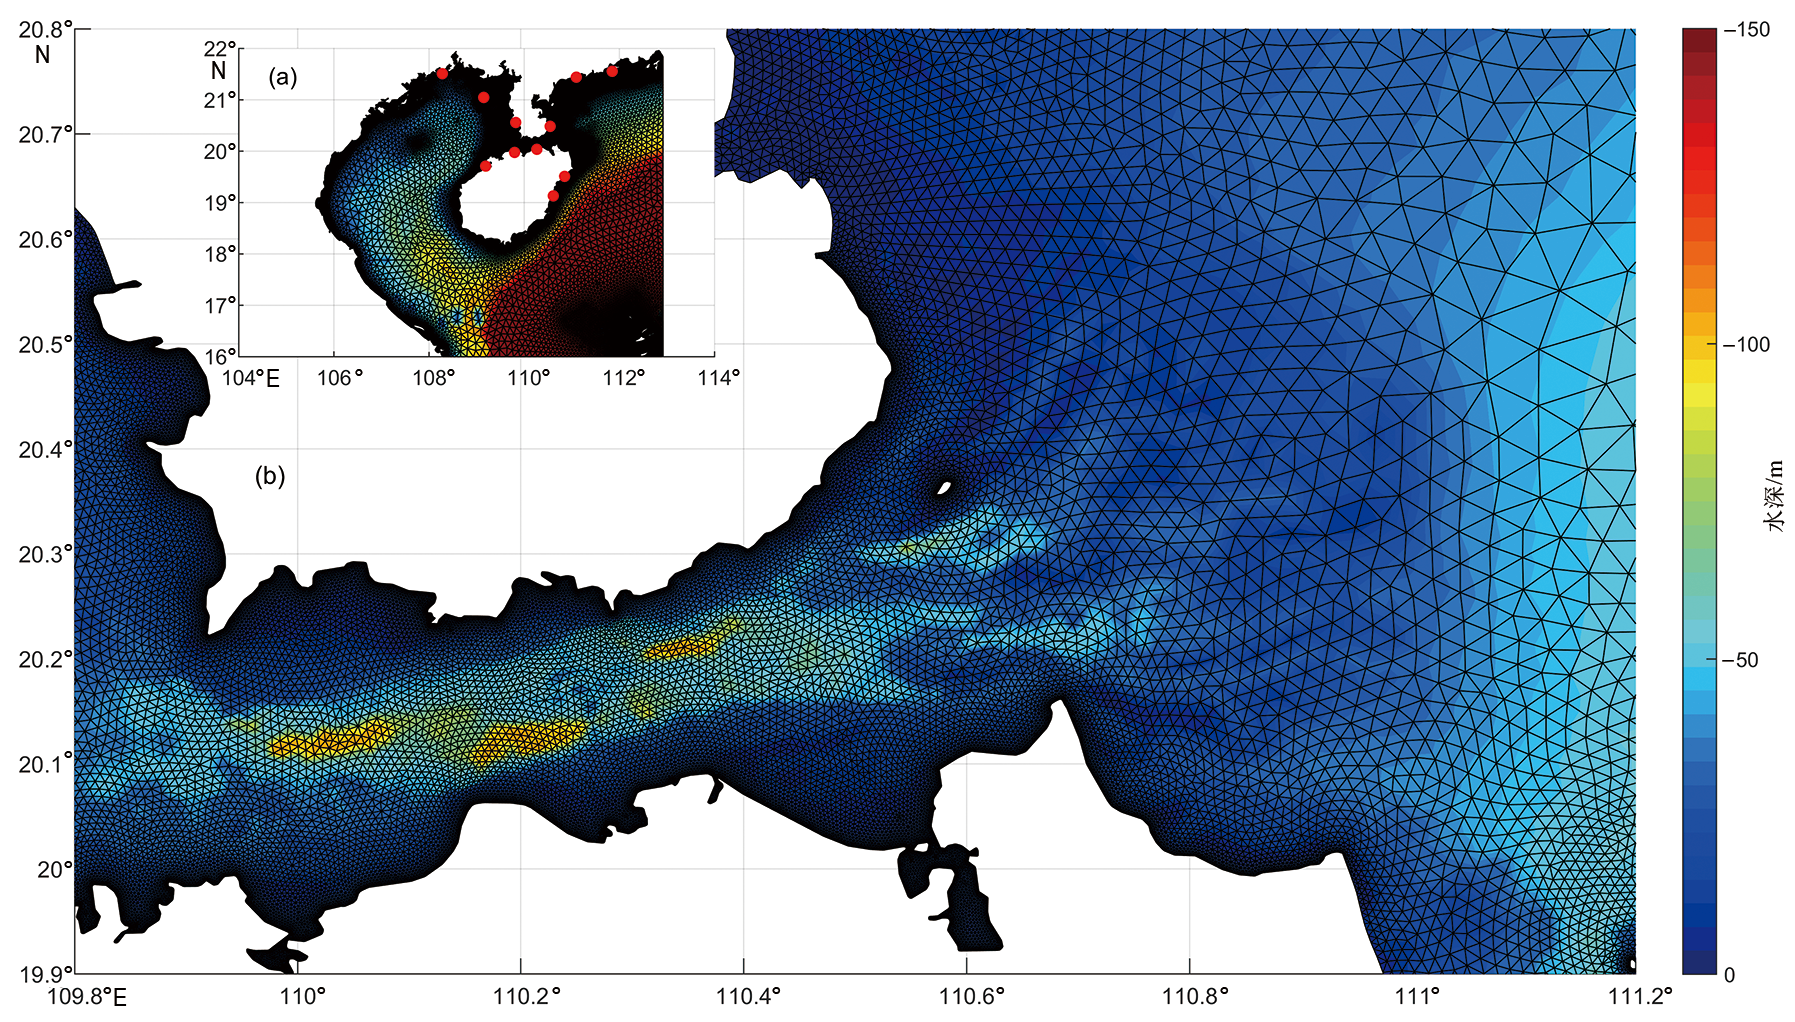
Fig.2 Numerical simulation of tidal currents in the Qiongzhou Strait. (a) Simulation area and tidal monitoring stations (red dots). (b) Horizontal grid configuration and topography of the simulation area.
| 站点 | M2 | S2 | K1 | O1 | ||||||||||
|---|---|---|---|---|---|---|---|---|---|---|---|---|---|---|
| 相位 | 振幅 | 相位 | 振幅 | 相位 | 振幅 | 相位 | 振幅 | |||||||
| 海陵山岛 | 185(191) | 0.58(0.62) | 209(221) | 0.26(0.26) | 73(61) | 0.39(0.40) | 42(45) | 0.33(0.40) | ||||||
| 水东港 | 195(197) | 0.68(0.74) | 219(232) | 0.33(0.36) | 81(61) | 0.39(0.41) | 50(50) | 0.35(0.39) | ||||||
| 下港 | 211(220) | 0.52(0.58) | 234(242) | 0.25(0.20) | 108(102) | 0.33(0.34) | 79(76) | 0.32(0.31) | ||||||
| 清澜港 | 198(208) | 0.25(0.27) | 226(239) | 0.10(0.10) | 69(65) | 0.30(0.31) | 41(47) | 0.26(0.27) | ||||||
| 博鳌 | 197(199) | 0.21(0.20) | 221(227) | 0.08(0.09) | 72(58) | 0.30(0.30) | 40(41) | 0.26(0.30) | ||||||
| 洋浦 | 37(34) | 0.17(0.20) | 76(62) | 0.06(0.07) | 206(203) | 0.75(0.70) | 163(163) | 0.84(0.83) | ||||||
| 红牌港 | 106(96) | 0.17(0.11) | 161(165) | 0.08(0.08) | 209(206) | 0.65(0.61) | 167(167) | 0.73(0.73) | ||||||
| 海口 | 163(154) | 0.20(0.19) | 201(196) | 0.13(0.16) | 200(214) | 0.37(0.38) | 162(170) | 0.46(0.50) | ||||||
| 乌石 | 72(87) | 0.21(0.17) | 126(103) | 0.06(0.00) | 203(215) | 0.80(0.67) | 161(165) | 0.88(0.84) | ||||||
| 涠洲岛 | 68(75) | 0.27(0.31) | 103(89) | 0.08(0.07) | 210(197) | 0.91(0.92) | 167(162) | 0.97(1.07) | ||||||
| 企沙 | 77(84) | 0.27(0.30) | 108(122) | 0.08(0.09) | 215(214) | 0.95(0.96) | 172(168) | 1.00(1.04) | ||||||
Table 1 Comparison between tidal simulation results and observation data (inside parentheses) at monitoring stations
| 站点 | M2 | S2 | K1 | O1 | ||||||||||
|---|---|---|---|---|---|---|---|---|---|---|---|---|---|---|
| 相位 | 振幅 | 相位 | 振幅 | 相位 | 振幅 | 相位 | 振幅 | |||||||
| 海陵山岛 | 185(191) | 0.58(0.62) | 209(221) | 0.26(0.26) | 73(61) | 0.39(0.40) | 42(45) | 0.33(0.40) | ||||||
| 水东港 | 195(197) | 0.68(0.74) | 219(232) | 0.33(0.36) | 81(61) | 0.39(0.41) | 50(50) | 0.35(0.39) | ||||||
| 下港 | 211(220) | 0.52(0.58) | 234(242) | 0.25(0.20) | 108(102) | 0.33(0.34) | 79(76) | 0.32(0.31) | ||||||
| 清澜港 | 198(208) | 0.25(0.27) | 226(239) | 0.10(0.10) | 69(65) | 0.30(0.31) | 41(47) | 0.26(0.27) | ||||||
| 博鳌 | 197(199) | 0.21(0.20) | 221(227) | 0.08(0.09) | 72(58) | 0.30(0.30) | 40(41) | 0.26(0.30) | ||||||
| 洋浦 | 37(34) | 0.17(0.20) | 76(62) | 0.06(0.07) | 206(203) | 0.75(0.70) | 163(163) | 0.84(0.83) | ||||||
| 红牌港 | 106(96) | 0.17(0.11) | 161(165) | 0.08(0.08) | 209(206) | 0.65(0.61) | 167(167) | 0.73(0.73) | ||||||
| 海口 | 163(154) | 0.20(0.19) | 201(196) | 0.13(0.16) | 200(214) | 0.37(0.38) | 162(170) | 0.46(0.50) | ||||||
| 乌石 | 72(87) | 0.21(0.17) | 126(103) | 0.06(0.00) | 203(215) | 0.80(0.67) | 161(165) | 0.88(0.84) | ||||||
| 涠洲岛 | 68(75) | 0.27(0.31) | 103(89) | 0.08(0.07) | 210(197) | 0.91(0.92) | 167(162) | 0.97(1.07) | ||||||
| 企沙 | 77(84) | 0.27(0.30) | 108(122) | 0.08(0.09) | 215(214) | 0.95(0.96) | 172(168) | 1.00(1.04) | ||||||

Fig.3 Simulated maximum tidal current fields around the Qiongzhou Strait during spring tides
| 区域位置 | 潮汐类型 | 不同形式和方向的潮流的平均流速/(m·s-1) | ||||||
|---|---|---|---|---|---|---|---|---|
| 涨潮西流 | 落潮西流 | 涨潮东流 | 落潮东流 | 西向流 | 东向流 | |||
| 中央水道 | 大潮 | 0.87 | 0.97 | 1.40 | 0.48 | 0.92 | 1.07 | |
| 小潮 | 0.25 | 0.61 | 0.40 | 0.56 | 0.46 | 0.46 | ||
| 浅滩区 | 大潮 | 0.83 | 0.66 | 1.10 | 0.66 | 0.74 | 0.94 | |
| 小潮 | 0.26 | 0.41 | 0.34 | 0.55 | 0.35 | 0.42 | ||
| 海峡南岸 | 大潮 | 0.54 | 0.37 | 0.66 | 0.31 | 0.45 | 0.53 | |
| 小潮 | 0.23 | 0.25 | 0.30 | 0.28 | 0.25 | 0.29 | ||
| 海峡北岸 | 大潮 | 0.95 | 1.02 | 1.18 | 0.42 | 0.99 | 0.90 | |
| 小潮 | 0.27 | 0.57 | 0.35 | 0.39 | 0.45 | 0.37 | ||
| 东部陆架 | 大潮 | 0.38 | 0.27 | 0.29 | 0.47 | 0.32 | 0.36 | |
| 小潮 | 0.16 | 0.11 | 0.11 | 0.22 | 0.13 | 0.15 | ||
| 全区 | 大潮 | 0.67 | 0.57 | 0.86 | 0.50 | 0.62 | 0.73 | |
| 小潮 | 0.23 | 0.35 | 0.29 | 0.39 | 0.30 | 0.33 | ||
Table 2 Average seawater velocity under typical tidal phases at the eastern entrance to the Qiongzhou Strait
| 区域位置 | 潮汐类型 | 不同形式和方向的潮流的平均流速/(m·s-1) | ||||||
|---|---|---|---|---|---|---|---|---|
| 涨潮西流 | 落潮西流 | 涨潮东流 | 落潮东流 | 西向流 | 东向流 | |||
| 中央水道 | 大潮 | 0.87 | 0.97 | 1.40 | 0.48 | 0.92 | 1.07 | |
| 小潮 | 0.25 | 0.61 | 0.40 | 0.56 | 0.46 | 0.46 | ||
| 浅滩区 | 大潮 | 0.83 | 0.66 | 1.10 | 0.66 | 0.74 | 0.94 | |
| 小潮 | 0.26 | 0.41 | 0.34 | 0.55 | 0.35 | 0.42 | ||
| 海峡南岸 | 大潮 | 0.54 | 0.37 | 0.66 | 0.31 | 0.45 | 0.53 | |
| 小潮 | 0.23 | 0.25 | 0.30 | 0.28 | 0.25 | 0.29 | ||
| 海峡北岸 | 大潮 | 0.95 | 1.02 | 1.18 | 0.42 | 0.99 | 0.90 | |
| 小潮 | 0.27 | 0.57 | 0.35 | 0.39 | 0.45 | 0.37 | ||
| 东部陆架 | 大潮 | 0.38 | 0.27 | 0.29 | 0.47 | 0.32 | 0.36 | |
| 小潮 | 0.16 | 0.11 | 0.11 | 0.22 | 0.13 | 0.15 | ||
| 全区 | 大潮 | 0.67 | 0.57 | 0.86 | 0.50 | 0.62 | 0.73 | |
| 小潮 | 0.23 | 0.35 | 0.29 | 0.39 | 0.30 | 0.33 | ||

Fig.4 Time series of tidal current speeds (lines) and flow directions during spring (left) and neap (right) tides

Fig.5 Contour maps of grain-size parameters and gravel/sand contents in the study area

Fig.6 Contour map of critical incipient velocity 1 m above the seabed

Fig.7 Spatiotemporal distribution of transport starting areas (shaded areas) in the study area during spring tides
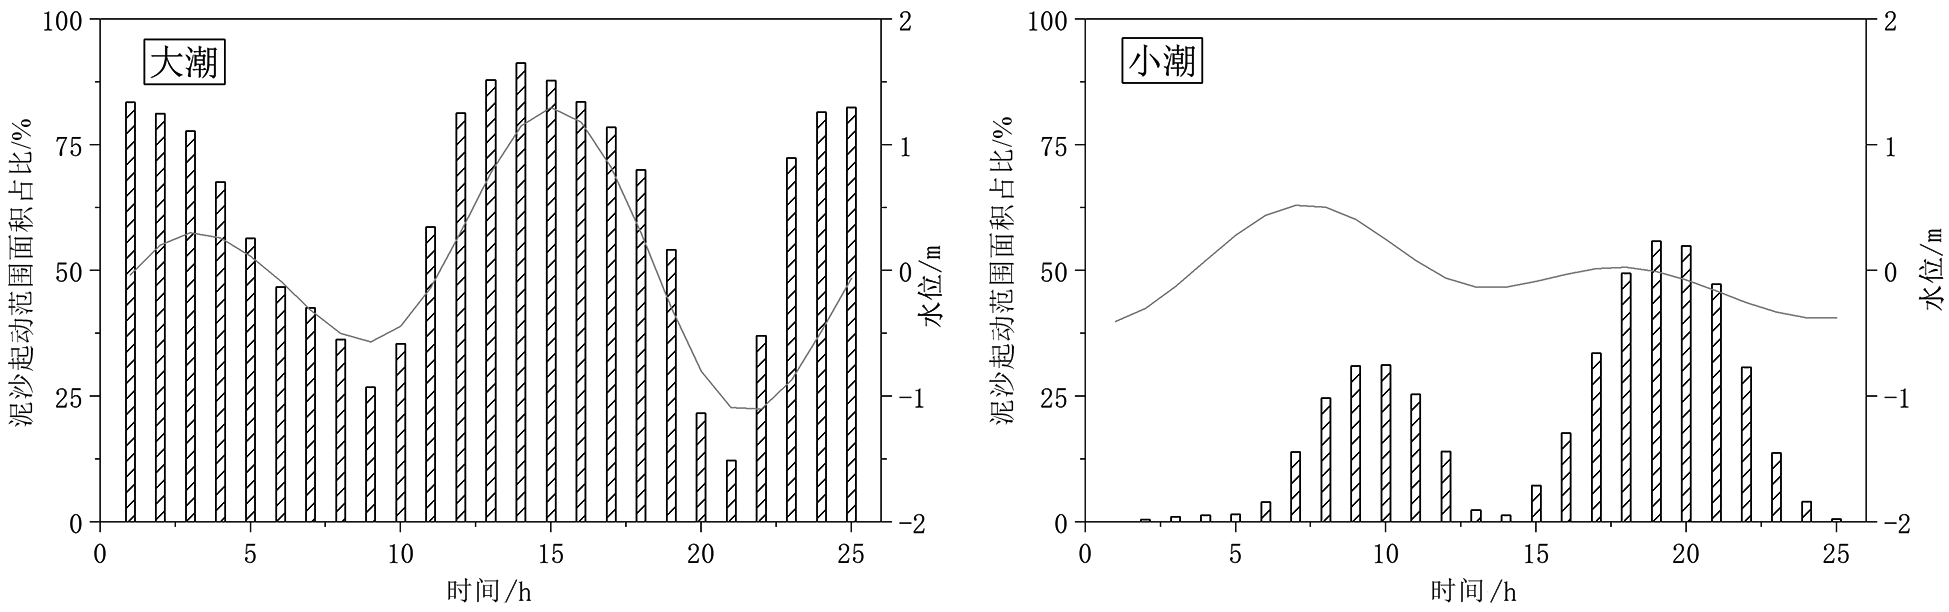
Fig.8 Time series charts of transport starting-area ratios for the study area during spring (left) and neap (right) tides
| 区域位置 | 潮汐类型 | 各种潮流形式的推移质输运率/(kg·m-1·s-1) | ||||
|---|---|---|---|---|---|---|
| 涨潮西流 | 落潮西流 | 涨潮东流 | 落潮东流 | 全潮周期平均 | ||
| 中央水道 | 大潮 | 0.037 81 | 0.079 38 | 0.151 54 | 0.006 56 | 0.074 80 |
| 小潮 | 0.000 03 | 0.003 26 | 0.002 22 | 0.002 52 | 0.002 00 | |
| 浅滩区 | 大潮 | 0.062 16 | 0.044 24 | 0.182 30 | 0.041 59 | 0.085 01 |
| 小潮 | 0.000 31 | 0.002 82 | 0.005 00 | 0.009 69 | 0.004 26 | |
| 海峡南岸 | 大潮 | 0.029 50 | 0.011 44 | 0.079 28 | 0.009 32 | 0.034 47 |
| 小潮 | 0.000 71 | 0.001 73 | 0.005 17 | 0.001 89 | 0.002 58 | |
| 海峡北岸 | 大潮 | 0.109 79 | 0.173 31 | 0.216 36 | 0.015 34 | 0.138 39 |
| 小潮 | 0.002 12 | 0.022 41 | 0.012 66 | 0.005 81 | 0.010 95 | |
| 东部陆架 | 大潮 | 0.008 10 | 0.002 23 | 0.006 65 | 0.021 50 | 0.007 87 |
| 小潮 | 0.000 00 | 0.000 00 | 0.000 00 | 0.000 05 | 0.000 01 | |
| 全区 | 大潮 | 0.050 33 | 0.052 70 | 0.136 11 | 0.024 56 | 0.069 03 |
| 小潮 | 0.000 52 | 0.004 68 | 0.004 80 | 0.005 30 | 0.003 81 | |
Table 3 Bedload transport rates under different current flow styles in the study area
| 区域位置 | 潮汐类型 | 各种潮流形式的推移质输运率/(kg·m-1·s-1) | ||||
|---|---|---|---|---|---|---|
| 涨潮西流 | 落潮西流 | 涨潮东流 | 落潮东流 | 全潮周期平均 | ||
| 中央水道 | 大潮 | 0.037 81 | 0.079 38 | 0.151 54 | 0.006 56 | 0.074 80 |
| 小潮 | 0.000 03 | 0.003 26 | 0.002 22 | 0.002 52 | 0.002 00 | |
| 浅滩区 | 大潮 | 0.062 16 | 0.044 24 | 0.182 30 | 0.041 59 | 0.085 01 |
| 小潮 | 0.000 31 | 0.002 82 | 0.005 00 | 0.009 69 | 0.004 26 | |
| 海峡南岸 | 大潮 | 0.029 50 | 0.011 44 | 0.079 28 | 0.009 32 | 0.034 47 |
| 小潮 | 0.000 71 | 0.001 73 | 0.005 17 | 0.001 89 | 0.002 58 | |
| 海峡北岸 | 大潮 | 0.109 79 | 0.173 31 | 0.216 36 | 0.015 34 | 0.138 39 |
| 小潮 | 0.002 12 | 0.022 41 | 0.012 66 | 0.005 81 | 0.010 95 | |
| 东部陆架 | 大潮 | 0.008 10 | 0.002 23 | 0.006 65 | 0.021 50 | 0.007 87 |
| 小潮 | 0.000 00 | 0.000 00 | 0.000 00 | 0.000 05 | 0.000 01 | |
| 全区 | 大潮 | 0.050 33 | 0.052 70 | 0.136 11 | 0.024 56 | 0.069 03 |
| 小潮 | 0.000 52 | 0.004 68 | 0.004 80 | 0.005 30 | 0.003 81 | |

Fig.9 Contour maps of average daily net bedload transport fluxes. (a) During spring tides; (b) during neap tides; (c) eastward flux during spring tides; (d) northward flux during spring tides.
| 统计指标 | 推移质单宽净输运量/(kg·m-1·d-1) | ||||||
|---|---|---|---|---|---|---|---|
| 大潮期 | 小潮期 | ||||||
| 全区 | 西向输运 (占比39%) | 东向输运 (占比61%) | 全区 | 西向输运 (占比17%) | 东向输运 (占比83%) | ||
| 均值 | 2 617.97 | 2 021.87 | 2 910.61 | 294.66 | 262.74 | 300.71 | |
| 中位数 | 1 429.56 | 718.40 | 1 750.36 | 111.87 | 116.97 | 109.69 | |
| 最大值 | 33 476.52 | 33 476.52 | 27 855.00 | 9 875.12 | 2 726.61 | 9 875.12 | |
Table 4 Data of net bedload transport fluxes in the study area
| 统计指标 | 推移质单宽净输运量/(kg·m-1·d-1) | ||||||
|---|---|---|---|---|---|---|---|
| 大潮期 | 小潮期 | ||||||
| 全区 | 西向输运 (占比39%) | 东向输运 (占比61%) | 全区 | 西向输运 (占比17%) | 东向输运 (占比83%) | ||
| 均值 | 2 617.97 | 2 021.87 | 2 910.61 | 294.66 | 262.74 | 300.71 | |
| 中位数 | 1 429.56 | 718.40 | 1 750.36 | 111.87 | 116.97 | 109.69 | |
| 最大值 | 33 476.52 | 33 476.52 | 27 855.00 | 9 875.12 | 2 726.61 | 9 875.12 | |
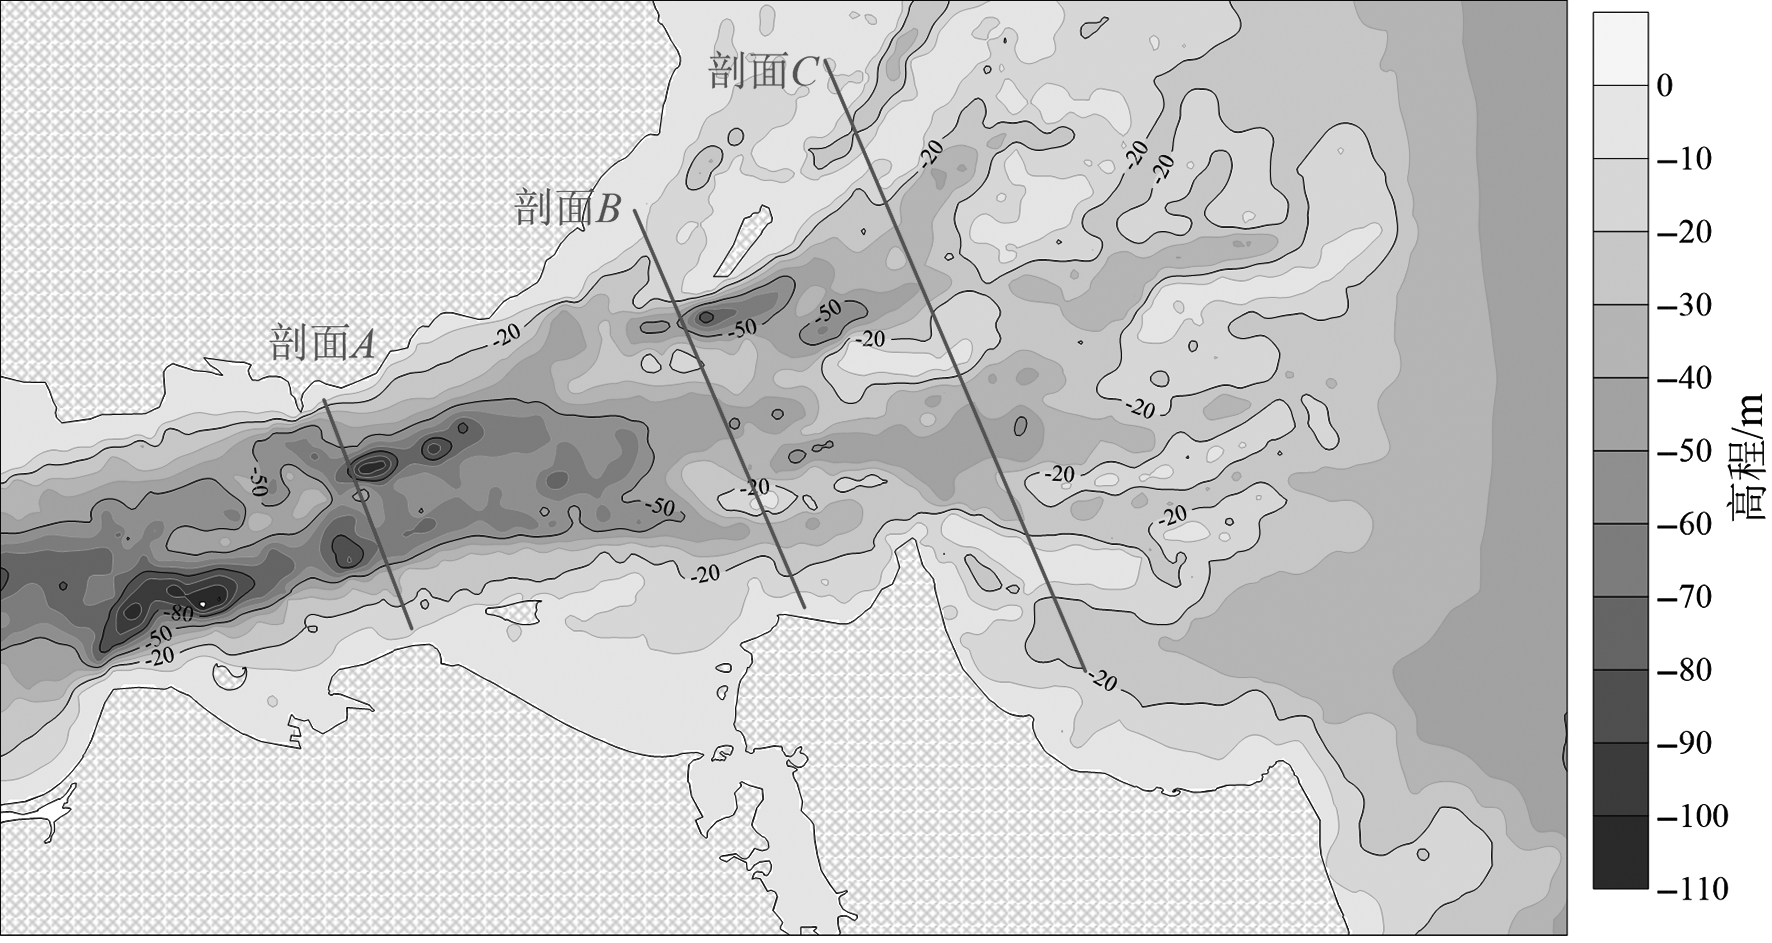
Fig.10 Location of three sections used in bedload flux calculation
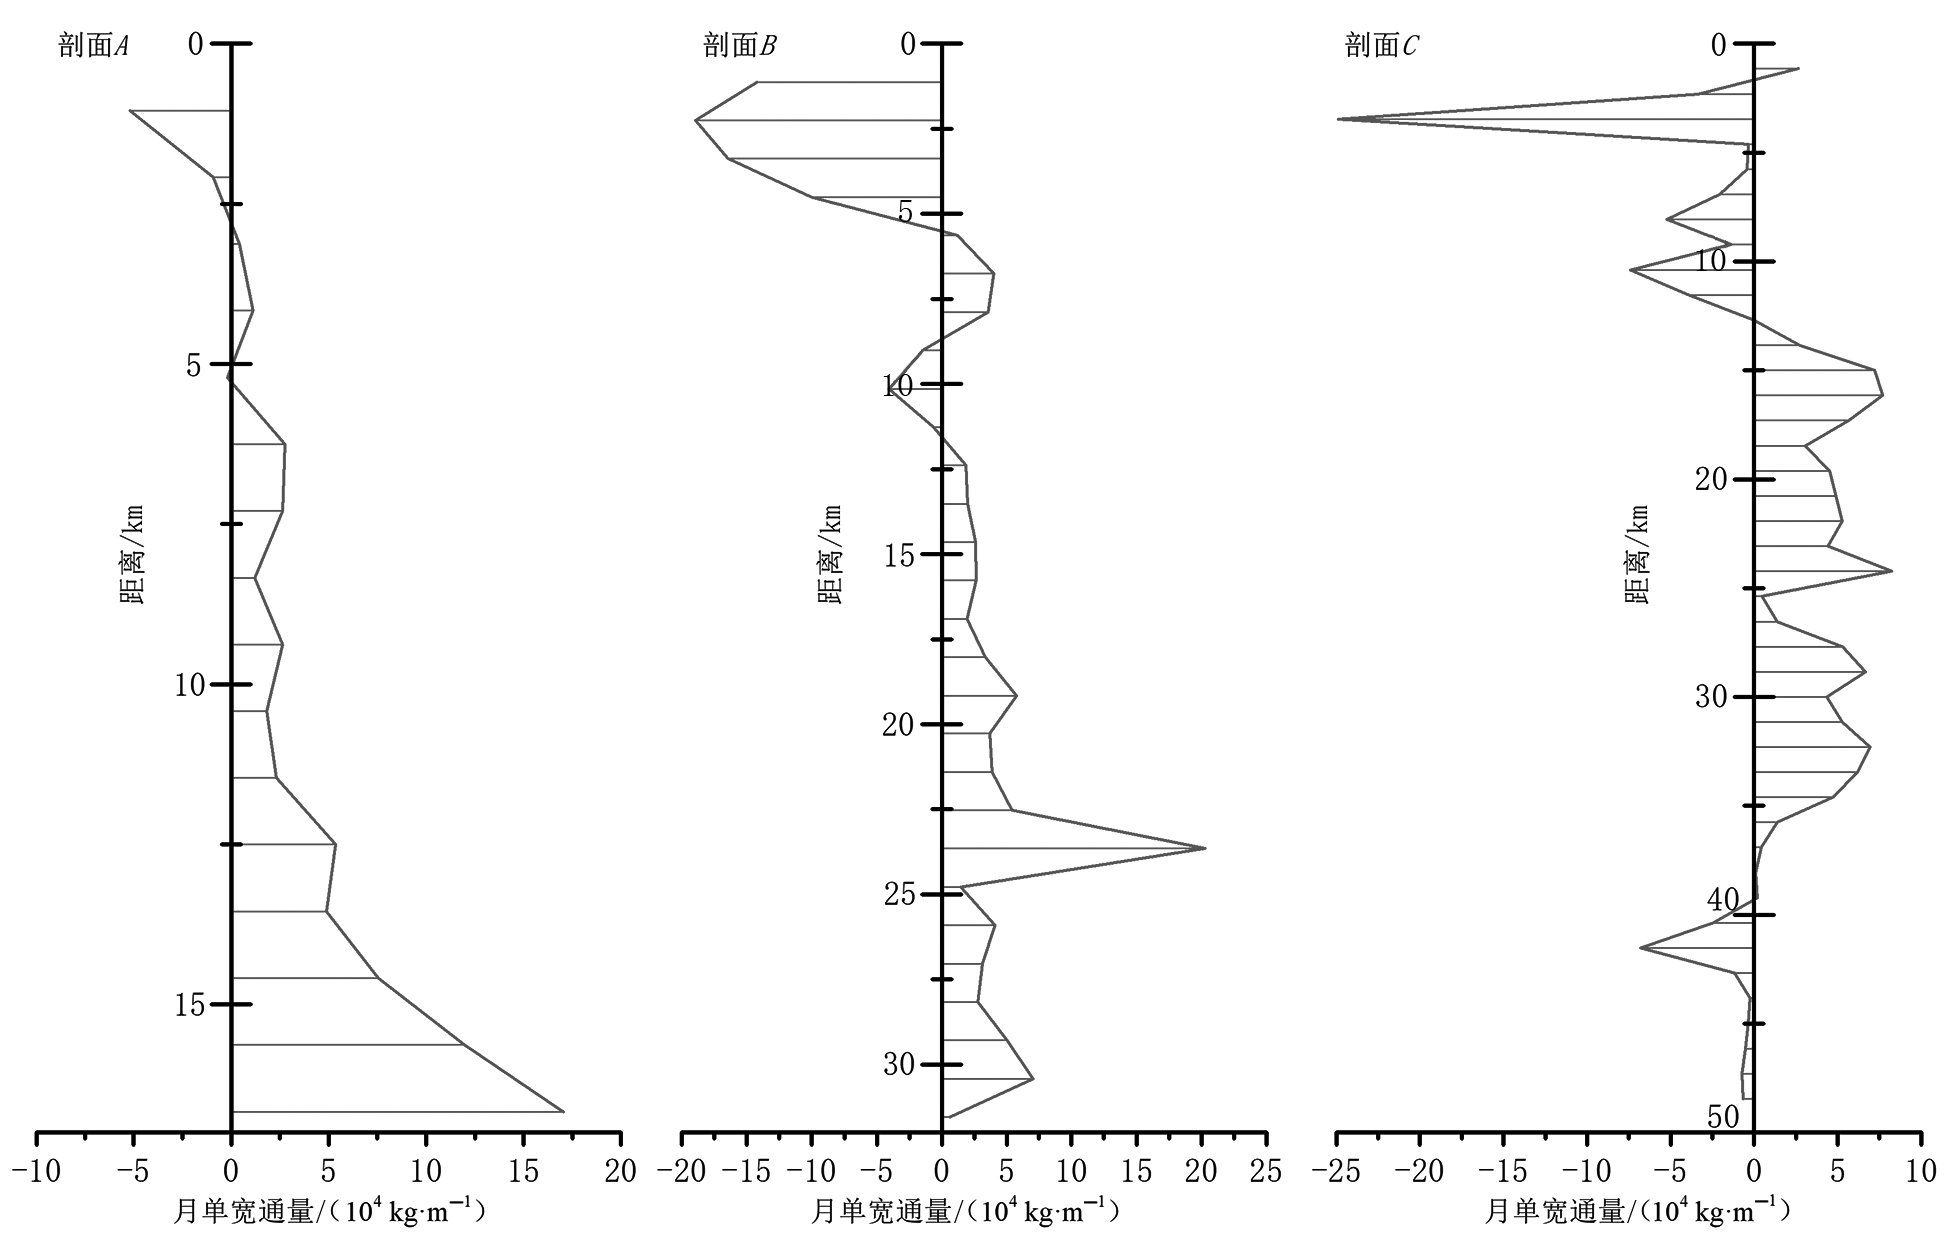
Fig.11 Monthly bedload fluxes at the three vertical sections of the Qiongzhou Strait
| 剖面名称 | 月净通量/ kg | 月均单宽通量/(kg·m-1) | ||
|---|---|---|---|---|
| 剖面均值 | 东向最大 | 西向最大 | ||
| 剖面A | 5.78×10⁸ | 34 652 | 170 421 | 51 762 |
| 剖面B | 2.29×10⁸ | 7 251 | 202 680 | 189 422 |
| 剖面C | 4.38×10⁸ | 9 032 | 82 514 | 248 999 |
Table 5 Monthly bedload transport statistics at the three sections of the Qiongzhou Strait
| 剖面名称 | 月净通量/ kg | 月均单宽通量/(kg·m-1) | ||
|---|---|---|---|---|
| 剖面均值 | 东向最大 | 西向最大 | ||
| 剖面A | 5.78×10⁸ | 34 652 | 170 421 | 51 762 |
| 剖面B | 2.29×10⁸ | 7 251 | 202 680 | 189 422 |
| 剖面C | 4.38×10⁸ | 9 032 | 82 514 | 248 999 |
| [1] | 高抒, COLLINS M. 沉积物粒径趋势与海洋沉积动力学[J]. 中国科学基金, 1998, 12(4): 241-246. |
| [2] | 汪亚平, 高抒, 贾建军. 海底边界层水流结构及底移质搬运研究进展[J]. 海洋地质与第四纪地质, 2000, 20(3): 101-106. |
| [3] | 贾建军, 汪亚平, 高抒, 等. 江苏大丰潮滩推移质输运与粒度趋势信息解译[J]. 科学通报, 2005, 50(22): 2546-2554. |
| [4] | 杜晓琴, 李炎, 高抒. 台湾浅滩大型沙波、潮流结构和推移质输运特征[J]. 海洋学报, 2008, 30(5): 124-136. |
| [5] | 李东义, 陈坚, 汪亚平, 等. 强潮河口区近底部沉积动力过程的高分辨率观测与分析[J]. 沉积学报, 2014, 32(2): 278-289. |
| [6] | 王爱军, 叶翔, 赖志坤, 等. 闽江口及周边海域沉积物输运及资源效应[J]. 海洋与湖沼, 2020, 51(5): 1013-1024. |
| [7] | 刘振夏, 夏东兴, 王揆洋. 中国陆架潮流沉积体系和模式[J]. 海洋与湖沼, 1998, 29(2): 141-147. |
| [8] |
NI Y G, ENDLER R, XIA Z, et al. The “butterfly delta” system of Qiongzhou Strait: morphology, seismic stratigraphy and sedimentation[J]. Marine Geology, 2014, 355: 361-368.
DOI URL |
| [9] | 仝长亮, 黎刚, 陈飞, 等. 海南岛东北部海域海砂资源特征及成因[J]. 海洋地质前沿, 2018, 34(1): 12-19. |
| [10] | 仝长亮, 张匡华, 陈飞, 等. 海南岛北部海域海砂资源潜力评价[J]. 中国地质, 2020, 47(5): 1567-1576. |
| [11] | 陈沈良. 琼州海峡南岸海岸动力地貌研究[J]. 热带海洋, 1998, 17(3): 34-42. |
| [12] | 陈达森, 陈波, 严金辉, 等. 琼州海峡余流场季节性变化特征[J]. 海洋湖沼通报, 2006(2): 12-17. |
| [13] | 侍茂崇. 北部湾环流研究述评[J]. 广西科学, 2014, 21(4): 313-324. |
| [14] |
SHI M C, CHEN C S, XU Q C, et al. The role of Qiongzhou Strait in the seasonal variation of the South China Sea circulation[J]. Journal of Physical Oceanography, 2002, 32(1): 103-121.
DOI URL |
| [15] | 杨士瑛, 鲍献文, 陈长胜, 等. 夏季粤西沿岸流特征及其产生机制[J]. 海洋学报, 2003, 25(6): 1-8. |
| [16] | 田明, 李春初. 海南岛南渡江于流河回泥沙转运与现代地貌过程[J]. 热带地理, 1994, 14(2): 105-112. |
| [17] | 程和琴, 胡红兵, 蒋智勇, 等. 琼州海峡东口底形平衡域谱分析[J]. 海洋工程, 2003, 21(4): 97-103. |
| [18] | 仝长亮, 王华强, 覃茂刚, 等. 琼州海峡东口潮流沙脊表层沉积物特征及沉积环境划分[J]. 应用海洋学学报, 2022, 41(4):625-636. |
| [19] |
YE F, ZHANG Y L, WANG H, et al. Cross-scale baroclinic simulation of the effect of channel dredging in an estuarine setting[J]. Water, 2018, 10(2): 163.
DOI URL |
| [20] | ROSA J, SILVA P, BERTIN X, et al. Waves, wind and tidal forcing on a sandpit morphodynamics[J]. Journal of Coastal Research, 2011, Special 64, 1070-1074. |
| [21] | 李嵩, 管卫兵, 曹振轶, 等. 大亚湾和大鹏湾两个相邻海湾潮波浅水变形的异同分析[J]. 海洋学研究, 2020, 38(3): 31-47. |
| [22] | BROVCHENKO I, MADERICH V. Study of the role of underwater canyons in sediment transport from the Black Sea east coast[J]. International Journal for Computational Civil and Structural Engineering, 2011, 7(2): 39-46. |
| [23] |
FOLK R L, ANDREWS P B, LEWIS D W. Detrital sedimentary rock classification and nomenclature for use in New Zealand[J]. New Zealand Journal of Geology and Geophysics, 1970, 13(4): 937-968.
DOI URL |
| [24] | BAGNOLD R. An approach to the sediment transport problem from general physics[R]. Washington: US Government Printing Office, 1966, 422-I:1-37. |
| [25] | HARDISTY J. An assessment and calibration of formulations forbagnold’s bedload equation[J]. SEPM Journal of Sedimentary Research, 1983, 53: 1007-1010. |
| [26] | SOULSBY R. Dynamics ofmarine sands[M]. London: Thomas Telford Services Limited, 1997:249. |
| [27] |
MILLER M C, MCCAVE I N, KOMAR P D. Threshold of sediment motion under unidirectional currents[J]. Sedimentology, 1977, 24(4): 507-527.
DOI URL |
| [28] |
WANG Y P, GAO S. Modification to thehardisty equation, regarding the relationship between sediment transport rate and particle size[J]. Journal of Sedimentary Research, 2001, 71(1): 118-121.
DOI URL |
| [29] | 郑淑贤. 基于FVCOM的琼州海峡潮汐潮流数值模拟与研究[D]. 青岛: 中国海洋大学, 2015. |
| [30] | 杨正清, 刘振宇, 李双伟, 等. 雷州半岛东部近岸海域潮流特征分析[J]. 广西科学, 2019, 26(6): 690-697. |
| [31] | 任叙合, 尤启明, 郭静, 等. 海南岛东北海域海流和余流特征分析[J]. 广西科学, 2018, 25(4):418-422. |
| [32] | 侍茂崇, 陈春华, 黄方, 等. 琼州海峡冬末春初潮余流场特征[J]. 海洋学报, 1998, 20(1): 1-10. |
| [33] | 李占海, 柯贤坤, 王倩, 等. 琼州海峡水沙输运特征研究[J]. 地理研究, 2003, 22(2): 151-159. |
| [34] | 彭学超. 琼州海峡地质构造特征及成因分析[J]. 南海地质研究, 2000(12): 44-57. |
| [35] | 许冬, 初凤友, 李家彪, 等. 粤西琼东北近海沉积物的运移和沉积[J]. 吉林大学学报(地球科学版), 2014, 44(3): 905-917. |
| [36] | 陈亮, 张玉芬, 李团结, 等. 琼州海峡及周边海域沉积环境及近万年以来沉积演化[J]. 地球科学: 中国地质大学学报, 2014, 39(6): 696-704. |
| [37] | 刘振夏, 夏东兴. 中国近海潮流沉积沙体[M]. 北京: 海洋出版社, 2004. |
| [38] | 田壮才, 郭秀军, 乔路正, 等. 南海北部海底沉积物临界起动流速空间分布特征分析[J]. 岩石力学与工程学报, 2016, 35(增刊2): 4287-4294. |
| [39] | 喻国良, 韦兵, 李明. 往复流作用下的粗颗粒推移质的输沙规律[J]. 华北水利水电大学学报(自然科学版), 2017, 38(3):58-63. |
| [40] |
CHENG H Q, LI J F, YIN D W, et al. Nearshore bedform instability in the eastern entrance to the Qiongzhou Strait, South China Sea[J]. Frontiers of Earth Science in China, 2008, 2(3): 283-291.
DOI URL |
| [41] |
WANG Y P, SHI B W, ZHANG L, et al. Assessing the vulnerability of changing coasts, Hainan Island, China[J]. Acta Oceanologica Sinica, 2017, 36(4): 114-120.
DOI URL |
| [1] | GAO Shu. Morphological and migration characteristics of largescaled submarine, coastal and desert sand dunes. [J]. Earth Science Frontiers, 2009, 16(6): 13-22. |
| Viewed | ||||||
|
Full text |
|
|||||
|
Abstract |
|
|||||