Earth Science Frontiers ›› 2020, Vol. 27 ›› Issue (5): 23-38.DOI: 10.13745/j.esf.sf.2020.5.34
Previous Articles Next Articles
YANG Zongfeng( ), LI Jie, JIANG Xiaojie, QU Linyu, YUAN Ye, LI Yingying, PENG Huizhong, RAO Tong, MA Ben, XU Zhihao
Received:2020-04-10
Revised:2020-06-02
Online:2020-09-25
Published:2020-09-25
CLC Number:
YANG Zongfeng, LI Jie, JIANG Xiaojie, QU Linyu, YUAN Ye, LI Yingying, PENG Huizhong, RAO Tong, MA Ben, XU Zhihao. Two dimensional quantitative textural analysis method for igneous rock[J]. Earth Science Frontiers, 2020, 27(5): 23-38.
| 观测方式 | 适合的样品面积 | 有效识别的粒径范围 | 适合分析的常见矿物 | 关键识别特征 |
|---|---|---|---|---|
| 光薄片透射光 | <100 cm2 | 0.03~5 mm | 透明矿物 | 干涉色、突起、环带和双晶 |
| 光薄片反射光 | <20 cm2 | 0.005~5 mm | 镁铁质矿物和反射光 能力强的副矿物 | 反射色和突起 |
| 光学显微镜阴极发光 | <20 cm2 | 0.005~5 mm | 长英质矿物、磷灰石、 锆石、萤石等 | 发光颜色和环带 |
| 电子背散射图 | <20 cm2 | 0.002~5 mm | 镁铁质矿物为主 | 灰度和环带 |
| 光片扫描 | >100 cm2 | 0.3~5 cm | 易染色或肉眼易识别的矿物 | 颜色和环带 |
| 野外露头 | >300 cm2 | >0.5 cm | 肉眼易识别矿物 | 颜色和环带 |
Table 1 The commonly used observation methods in the two-dimensional quantitative textural analysis in igneous petrology
| 观测方式 | 适合的样品面积 | 有效识别的粒径范围 | 适合分析的常见矿物 | 关键识别特征 |
|---|---|---|---|---|
| 光薄片透射光 | <100 cm2 | 0.03~5 mm | 透明矿物 | 干涉色、突起、环带和双晶 |
| 光薄片反射光 | <20 cm2 | 0.005~5 mm | 镁铁质矿物和反射光 能力强的副矿物 | 反射色和突起 |
| 光学显微镜阴极发光 | <20 cm2 | 0.005~5 mm | 长英质矿物、磷灰石、 锆石、萤石等 | 发光颜色和环带 |
| 电子背散射图 | <20 cm2 | 0.002~5 mm | 镁铁质矿物为主 | 灰度和环带 |
| 光片扫描 | >100 cm2 | 0.3~5 cm | 易染色或肉眼易识别的矿物 | 颜色和环带 |
| 野外露头 | >300 cm2 | >0.5 cm | 肉眼易识别矿物 | 颜色和环带 |

Fig.1 The transmission micrograph and quartz outlines of Shanggusi granite porphyry

Fig.2 The difference of the different extinction positions of the aggregated quartz in Shanggusi granite porphyry

Fig.3 Petrographic characteristics of two basaltic rock samples under transmitted and reflected light

Fig.4 Comparison of back scattering and pseudo color map of a basalt matrix

Fig.5 Comparison of the optical characteristics of the main rock-forming minerals and accessory minerals of a granite under polarized microscope transmission light and cathodoluminescence

Fig.6 Photo scanning map of a basalt with plagioclase megacryst

Fig.7 Photos of alkaline feldspar phenocrysts in a porphyritic granite after dyeing
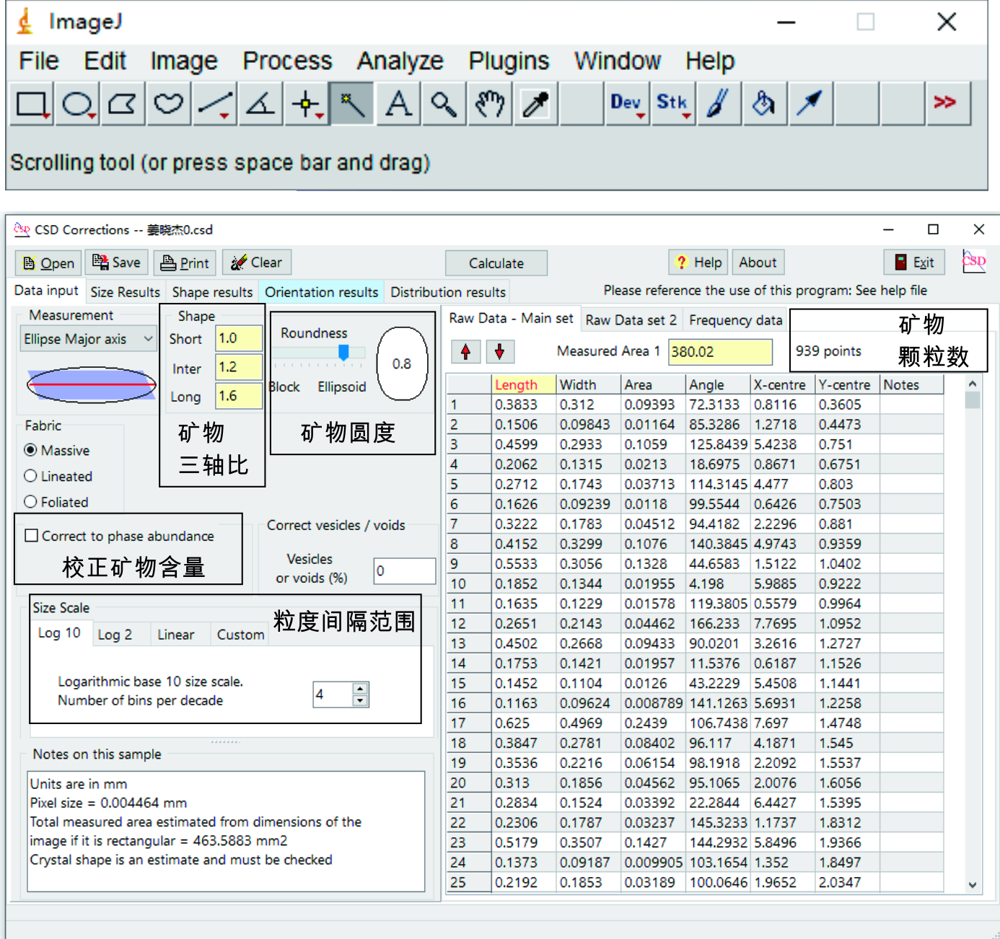
Fig.8 Operation interface of ImageJ and CSDCorrections software[6]
| 颗粒 数/个 | 面积 /mm2 | 圆度 | 三维形态 | 形态 拟合度 | 面积含 量/% | CSD 体积/% | 截距 | 斜率 | Q | 最大颗粒 粒径/mm | R | AF | |
|---|---|---|---|---|---|---|---|---|---|---|---|---|---|
| 独 立 分 析 | 578 | 191.95 | 0.7 | 1∶1.3∶2 | 0.90 | 12.2 | 18.7±4.4 | 4.94±0.20 | -5.54±0.40 | 0.72 | 1.20±0.26 | 1.04 | 0.10 |
| 284 | 120.20 | 0.8 | 1∶1.25∶1.8 | 0.94 | 11.6 | 18.1±5.6 | 4.45±0.30 | -4.98±0.56 | 0.40 | 0.81±0.09 | 1.21 | 0.21 | |
| 502 | 190.93 | 0.7 | 1∶1.2∶1.6 | 0.89 | 12.9 | 19.6±5.0 | 4.47±0.24 | -5.27±0.48 | 0.37 | 1.11±0.13 | 1.12 | 0.20 | |
| 961 | 380.02 | 0.8 | 1∶1.2∶1.6 | 0.87 | 12.7 | 20.0±4.6 | 4.71±0.16 | -5.56±0.32 | 0.38 | 1.09±0.07 | 1.14 | 0.22 | |
| 490 | 133.46 | 0.7 | 1∶1.3∶1.4 | 0.90 | 14.4 | 18.5±5.2 | 5.37±0.26 | -7.47±0.70 | 0.07 | 0.97±0.13 | 1.08 | 0.19 | |
| 261 | 92.58 | 0.8 | 1∶1.1∶1.5 | 0.90 | 13.5 | 19.9±7.2 | 4.81±0.32 | -5.74±0.66 | 0.71 | 1.08±0.33 | 1.16 | 0.17 | |
| 局 部 分 析 | 87 | 33.86 | 0.8 | 1∶1.25∶1.7 | 0.82 | 13.0 | 18.5±10.8 | 4.77±0.56 | -5.57±1.12 | 0.23 | 0.71±0.08 | 1.32 | 0.16 |
| 163 | 59.47 | 0.8 | 1∶1.2∶1.8 | 0.82 | 11.2 | 18.6±8.2 | 4.85±0.38 | -5.62±0.78 | 0.24 | 0.66±0.06 | 1.34 | 0.23 | |
| 218 | 102.38 | 0.8 | 1∶1.25∶1.8 | 0.90 | 11.4 | 16.1±6.0 | 4.54±0.32 | -5.27±0.62 | 0.01 | 0.99±0.07 | 1.22 | 0.19 | |
| 316 | 117.37 | 0.8 | 1∶1.3∶1.4 | 0.89 | 13.3 | 17.5±5.2 | 5.13±0.28 | -6.84±0.72 | 0.32 | 0.86±0.16 | 1.29 | 0.19 | |
| 399 | 152.11 | 0.8 | 1∶1.1∶1.5 | 0.87 | 12.1 | 20.8±5.6 | 4.82±0.24 | -5.66±0.52 | 0.57 | 0.82±0.03 | 1.22 | 0.21 | |
| 682 | 263.84 | 0.8 | 1∶1.25∶1.8 | 0.90 | 12.4 | 18.4±3.8 | 4.79±0.18 | -5.47±0.36 | 0.36 | 1.03±0.12 | 1.14 | 0.18 |
Table 2 Quantitative textural parameters of olivine phenocrysts in a basalt sample
| 颗粒 数/个 | 面积 /mm2 | 圆度 | 三维形态 | 形态 拟合度 | 面积含 量/% | CSD 体积/% | 截距 | 斜率 | Q | 最大颗粒 粒径/mm | R | AF | |
|---|---|---|---|---|---|---|---|---|---|---|---|---|---|
| 独 立 分 析 | 578 | 191.95 | 0.7 | 1∶1.3∶2 | 0.90 | 12.2 | 18.7±4.4 | 4.94±0.20 | -5.54±0.40 | 0.72 | 1.20±0.26 | 1.04 | 0.10 |
| 284 | 120.20 | 0.8 | 1∶1.25∶1.8 | 0.94 | 11.6 | 18.1±5.6 | 4.45±0.30 | -4.98±0.56 | 0.40 | 0.81±0.09 | 1.21 | 0.21 | |
| 502 | 190.93 | 0.7 | 1∶1.2∶1.6 | 0.89 | 12.9 | 19.6±5.0 | 4.47±0.24 | -5.27±0.48 | 0.37 | 1.11±0.13 | 1.12 | 0.20 | |
| 961 | 380.02 | 0.8 | 1∶1.2∶1.6 | 0.87 | 12.7 | 20.0±4.6 | 4.71±0.16 | -5.56±0.32 | 0.38 | 1.09±0.07 | 1.14 | 0.22 | |
| 490 | 133.46 | 0.7 | 1∶1.3∶1.4 | 0.90 | 14.4 | 18.5±5.2 | 5.37±0.26 | -7.47±0.70 | 0.07 | 0.97±0.13 | 1.08 | 0.19 | |
| 261 | 92.58 | 0.8 | 1∶1.1∶1.5 | 0.90 | 13.5 | 19.9±7.2 | 4.81±0.32 | -5.74±0.66 | 0.71 | 1.08±0.33 | 1.16 | 0.17 | |
| 局 部 分 析 | 87 | 33.86 | 0.8 | 1∶1.25∶1.7 | 0.82 | 13.0 | 18.5±10.8 | 4.77±0.56 | -5.57±1.12 | 0.23 | 0.71±0.08 | 1.32 | 0.16 |
| 163 | 59.47 | 0.8 | 1∶1.2∶1.8 | 0.82 | 11.2 | 18.6±8.2 | 4.85±0.38 | -5.62±0.78 | 0.24 | 0.66±0.06 | 1.34 | 0.23 | |
| 218 | 102.38 | 0.8 | 1∶1.25∶1.8 | 0.90 | 11.4 | 16.1±6.0 | 4.54±0.32 | -5.27±0.62 | 0.01 | 0.99±0.07 | 1.22 | 0.19 | |
| 316 | 117.37 | 0.8 | 1∶1.3∶1.4 | 0.89 | 13.3 | 17.5±5.2 | 5.13±0.28 | -6.84±0.72 | 0.32 | 0.86±0.16 | 1.29 | 0.19 | |
| 399 | 152.11 | 0.8 | 1∶1.1∶1.5 | 0.87 | 12.1 | 20.8±5.6 | 4.82±0.24 | -5.66±0.52 | 0.57 | 0.82±0.03 | 1.22 | 0.21 | |
| 682 | 263.84 | 0.8 | 1∶1.25∶1.8 | 0.90 | 12.4 | 18.4±3.8 | 4.79±0.18 | -5.47±0.36 | 0.36 | 1.03±0.12 | 1.14 | 0.18 |

Fig.9 Outlines and textural parameters of olivine phenocrysts from a basalt thin section
| [1] | HIGGINS M D. Numerical modeling of crystal shapes in thin-sections: estimation of crystal habit and true size[J]. American Mineralogist, 1994, 79(1/2):113-119. |
| [2] |
MORGAN D J, JERRAM D A. On estimating crystal shape for crystal size distribution analysis[J]. Journal of Volcanology and Geothermal Research, 2006, 154(1/2):1-7.
DOI URL |
| [3] |
HAMMER J E. Influence of f(O2) and cooling rate on the kinetics and energetics of Fe-rich basalt crystallization[J]. Earth and Planetary Science Letters, 2006, 248(3/4):618-637.
DOI URL |
| [4] |
MARSH B D. Crystal size distribution (CSD) in rocks and the kinetics and dynamics of crystallization Ⅰ. Theory[J]. Contributions to Mineralogy and Petrology, 1988, 99(3):277-291.
DOI URL |
| [5] | MARSH B D. On the interpretation of crystal size distributions in magmatic systems[J]. Journal of Petrology, 1998, 39(4):553-599. |
| [6] |
HIGGINS M D. Measurement of crystal size distributions[J]. American Mineralogist, 2000, 85(9):1105-1116.
DOI URL |
| [7] | 杨宗锋, 罗照华, 卢欣祥. 定量化火成岩结构分析与岩浆固结的动力学过程[J]. 地学前缘, 2010, 17(1):246-266. |
| [8] |
JERRAM D A, CHEADLE M J, HUNTER R H, et al. The spatial distribution of grains and crystals in rocks[J]. Contributions to Mineralogy and Petrology, 1996, 125(1):60-74.
DOI URL |
| [9] |
HARVEY P K, LAXTON R R. The estimation of finite strain from the orientation distribution of passively deformed linear markers: eigenvalue relationships[J]. Tectonophysics, 1980, 70(3/4):285-307.
DOI URL |
| [10] |
BOORMAN S, BOUDREAU A, KRUGER F J. The lower zone-critical zone transition of the Bushveld Complex: a quantitative textural study[J]. Journal of Petrology, 2004, 45(6):1209-1235.
DOI URL |
| [11] | HOLNESS M B, CHEADLE M J, MCKENZIE D. On the use of changes in dihedral angle to decode late-stage textural evolution in cumulates[J]. Journal of Petrology, 2005, 46(8):1565-1583. |
| [12] | HIGGINS M D. Quantitative textural measurements in igneous and metamorphic petrology[M]. Cambridge: Cambridge University Press, 2006: 276. |
| [13] |
MORGAN D J, JERRAM D A, CHERTKOFF D G, et al. Combining CSD and isotopic microanalysis: magma supply and mixing processes at Stromboli Volcano, Aeolian Islands, Italy[J]. Earth and Planetary Science Letters, 2007, 260(3/4):419-431.
DOI URL |
| [14] | HIGGINS M D. Quantitative petrological evidence for the origin of K-feldspar megacrysts in dacites from Taapaca volcano, Chile[J]. Contributions to Mineralogy and Petrology, 2011, 162(4):709-723. |
| [15] |
VINET N, HIGGINS M D. What can crystal size distributions and olivine compositions tell us about magma solidification processes inside Kilauea Iki lava lake, Hawaii?[J]. Journal of Volcanology and Geothermal Research, 2011, 208(3/4):136-162.
DOI URL |
| [16] | YANG Z F. Combining quantitative textural and geochemical studies to understand the solidification processes of a granite porphyry: Shanggusi, East Qinling, China[J]. Journal of Petrology, 2012, 53(9):1807-1835. |
| [17] | RUPRECHT P, BERGANTZ G W, COOPER K M, et al. The Crustal magma storage system of Volcan Quizapu, Chile, and the effects of magma mixing on magma diversity[J]. Journal of Petrology, 2012, 53(4):801-840. |
| [18] | CHUTAS N, BATES E, PREVEC S, et al. Sr and Pb isotopic disequilibrium between coexisting plagioclase and orthopyroxene in the Bushveld Complex, South Africa: microdrilling and progressive leaching evidence for sub-liquidus contamination within a crystal mush[J]. Contributions to Mineralogy and Petrology, 2012, 163(4):653-668. |
| [19] |
ZIEG M J. Petrologic evolution of a Nipigon diabase sill, Ontario, Canada: insights from compositional and textural profiles[J]. Economic Geology, 2014, 109(5):1383-1401.
DOI URL |
| [20] | YANG Z F, LUO Z H, LU X X, et al. The role of external fluid in the Shanggusi dynamic granitic magma system, East Qinling,China: quantitative integration of textural and chemical data[J]. Lithos, 2014, 208-209:339-360. |
| [21] |
RIKER J M, CASHMAN K V, RUST A C, et al. Experimental constraints on plagioclase crystallization during H2O- and H2O-CO2-saturated magma decompression[J]. Journal of Petrology, 2014, 56(10):1967-1998.
DOI URL |
| [22] | HIGGINS M, VOOS S, VANDER A J. Magmatic processes under Quizapu volcano, Chile, identified from geochemical and textural studies[J]. Contributions to Mineralogy and Petrology, 2015, 170(5/6):1-16. |
| [23] |
O’DRISCOLL B, CLAY P L, CAWTHORN R G, et al. Trevorite: Ni-rich spinel formed by metasomatism and desulfurization processes at Bon Accord, South Africa?[J]. Mineralogical Magazine, 2014, 78(1):145-163.
DOI URL |
| [24] |
NAMUR O, HUMPHREYS M C S, HOLNESS M B. Crystallization of interstitial liquid and latent heat buffering in solidifying gabbros: Skaergaard Intrusion, Greenland[J]. Journal of Petrology, 2014, 55(7):1389-1427.
DOI URL |
| [25] | HEPWORTH L N, O’DRISCOLL B, GERTISSER R, et al. Incremental construction of the unit 10 peridotite, Rum Eastern Layered Intrusion, NW Scotland[J]. Journal of Petrology, 2017, 58(1):137-166. |
| [26] |
BRADSHAW R W, KENT A J R, TEPLEY F J. Chemical fingerprints and residence times of olivine in the 1959 Kilauea Iki eruption, Hawaii: insights into picrite formation[J]. American Mineralogist, 2018, 103(11):1812-1826.
DOI URL |
| [27] |
HIGGINS M D, MARTIN P E M C. Chemical variations within and between the clasts, and the matrix of the Abee enstatite chondrite suggest an impact-based differentiation mechanism[J]. Geochimica et Cosmochimica Acta, 2018, 220:71-81.
DOI URL |
| [28] | CHENG L L, WANG Y, HERRIN J S, et al. Origin of K-feldspar megacrysts in rhyolites from the Emeishan large igneous province, southwest China[J]. Lithos, 2017, 294-295(Supplement C):397-411. |
| [29] |
MOCK A, JERRAM D A. Crystal size distributions (CSD) in three dimensions: insights from the 3D reconstruction of a highly porphyritic rhyolite[J]. Journal of Petrology, 2005, 46(8):1525-1541.
DOI URL |
| [30] | 徐飞, 罗照华, 杨宗锋, 等. 运用定量化结构分析方法揭示蚀变花岗斑岩的形成过程: 以新疆莫阿特茂金岩体为例[J]. 地质科学, 2015, 50(1):118-139. |
| [31] |
CASTRO J M, CASHMAN K V, MANGA M. A technique for measuring 3D crystal-size distributions of prismatic microtites in obsidian[J]. American Mineralogist, 2003, 88(8/9):1230-1240.
DOI URL |
| [32] |
HIGGINS M D. Quantitative investigation of felsic rock textures using cathodoluminescence images and other techniques[J]. Lithos, 2017, 277(Supplement C):259-268.
DOI URL |
| [33] | GÖTZE J, SCHERTL H P, NEUSER R, et al. Optical microscope-cathodoluminescence (OM-CL) imaging as a powerful tool to reveal internal textures of minerals[J]. Mineralogy and Petrology, 2013, 107(3):373-392. |
| [34] | CHENG L L, YANG Z F, ZENG L, et al. Giant plagioclase growth during storage of basaltic magma in Emeishan Large Igneous Province, SW China[J]. Contributions to Mineralogy and Petrology, 2014, 167(2):1-20. |
| [35] | ZHU Y X, WANG L X, MA C Q, et al. A flower-like glomerophyric diorite porphyry from Central China: constraints on the unusual texture[J]. Lithos, 2018, 318-319:1-13. |
| [36] | 李解, 罗照华, 杨宗锋, 等. 攀枝花铁矿朱家包包矿段层状铁矿体的成因: 来自矿物结构定量化分析的证据[J]. 地学前缘, 2016, 23(3):210-220. |
| [37] |
HIGGINS M D. Verification of ideal semi-logarithmic, lognormal or fractal crystal size distributions from 2D datasets[J]. Journal of Volcanology and Geothermal Research, 2006, 154(1/2):8-16.
DOI URL |
| [38] | TARQUINI S, FAVALLI M. A microscopic information system (MIS) for petrographic analysis[J]. Computers and Geosciences, 2010, 36(5):665-674. |
| [39] |
PRÊT D, SAMMARTINO S, BEAUFORT D, et al. A new method for quantitative petrography based on image processing of chemical element maps: Part I. Mineral mapping applied to compacted bentonites[J]. American Mineralogist, 2010, 95(10):1379-1388.
DOI URL |
| [40] | 罗照华, 杨宗锋, 代耕, 等. 火成岩的晶体群与成因矿物学展望[J]. 中国地质, 2013, 40(1):176-181. |
| Viewed | ||||||
|
Full text |
|
|||||
|
Abstract |
|
|||||